Prepared September 17, 2026 for the Hendreson family.
Every figure verified against county, federal and MLS-distributed records.
The bottom line
The house is worth more than it looks — but only after it is emptied.
Sold exactly as it stands today, with belongings still inside, the evidence supports about
$174,000. Clear the property out, clean it, and photograph it properly, and the same house supports
$183,000 to $186,000. That step costs roughly
$3,500 to $6,000 and it is the single highest-return decision
in this entire analysis.
If it is listed as it stands
$174,000
Contents in place. Photographs show belongings. The buyer pool narrows to investors, and offers come in under asking.
If it is cleared out first
$183,000 – $186,000
A $3,500–$6,000 clean-out returns
$3,000 to $8,500 net. Roughly three to four dollars back for every dollar spent.
Recommended list price
$184,900
After clean-out. That is $195 per sq ft — below every
similar-sized house that closed nearby this year.
Supported range
$183,000–$186,000
Six closed sales, adjusted line by line to this property.
Net gain from preparation
$3,000–$8,500
After paying for the clean-out itself.
How this analysis was built
Every number here was pulled from a primary source.
Nothing in this presentation is taken on trust from a listing portal. Lot sizes were measured from
the county parcel map. Flood status came from FEMA directly. Market trends came from the underlying sales
database rather than a marketing page.
Will County Assessor
Parcel number, ownership and the situs address for all nine properties, confirmed by PIN.
Will County GIS
Lot geometry measured from the county parcel layer — real dimensions, not rounded listing figures.
FEMA flood layer
Flood zone determined by intersecting each parcel polygon with the National Flood Hazard Layer.
Redfin Data Center
Twenty-four months of closed-sale statistics for ZIP 60432, straight from the market tracker file.
Three sales were confirmed twice
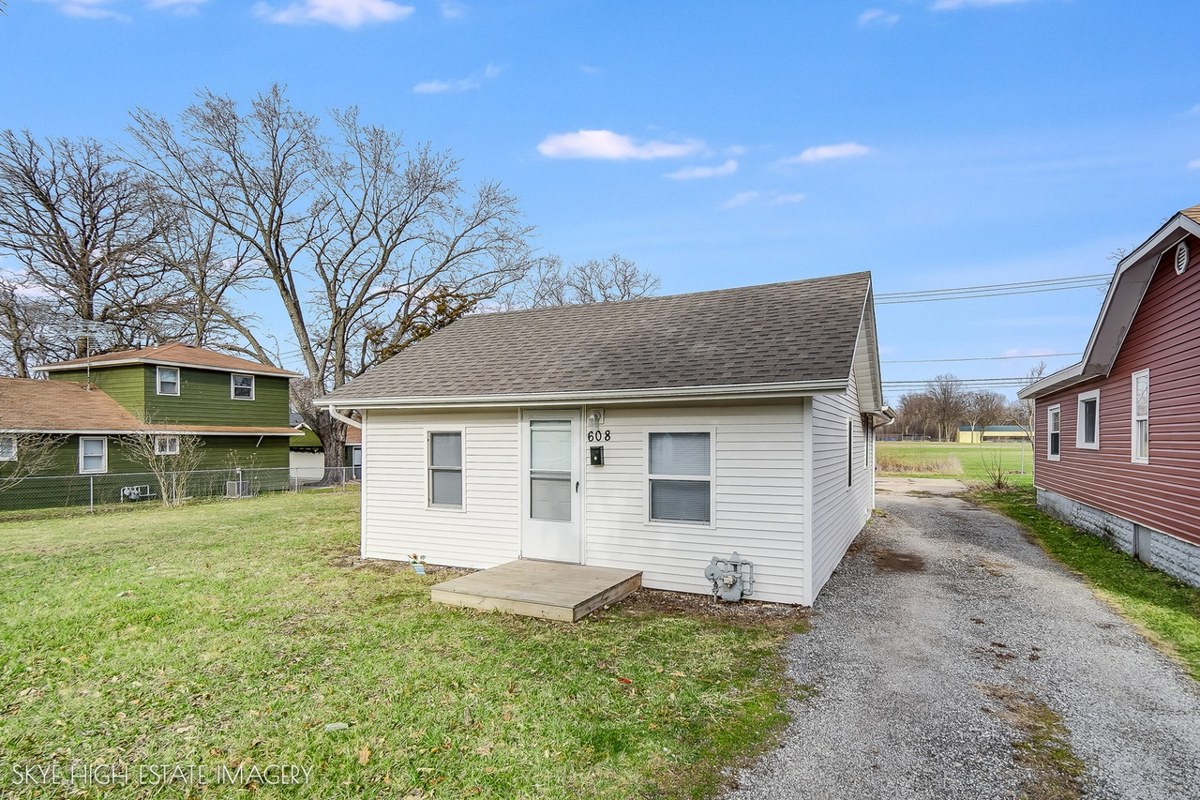
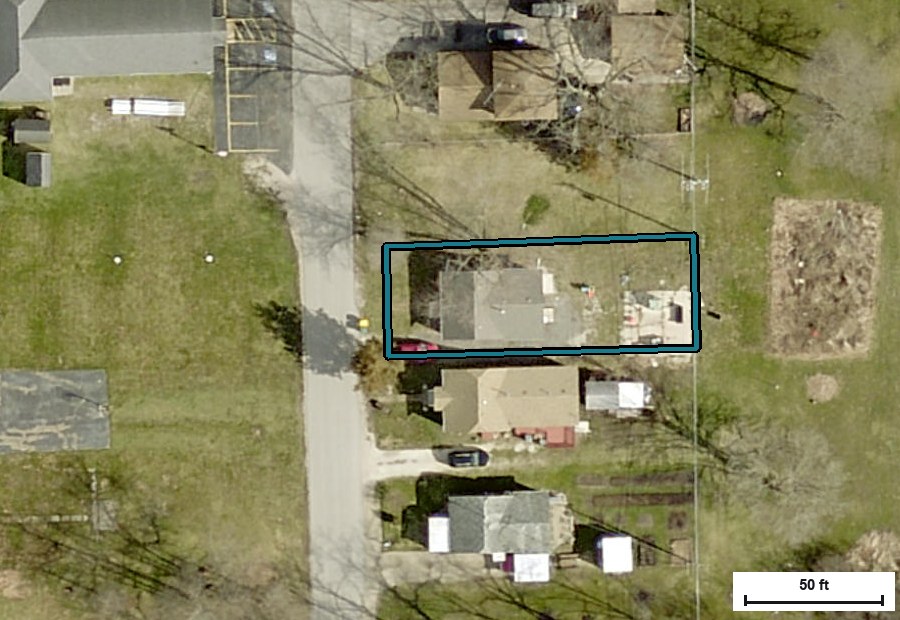
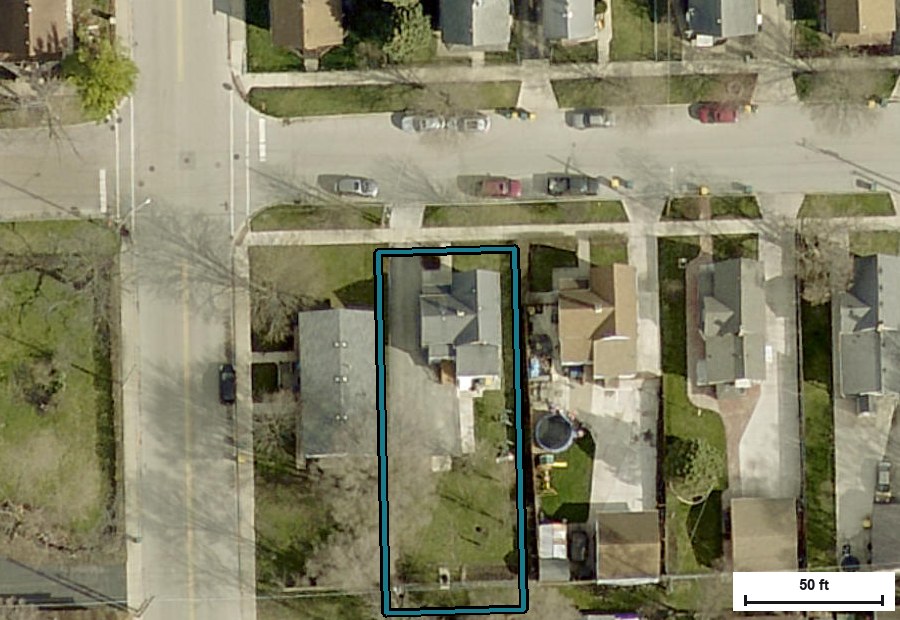
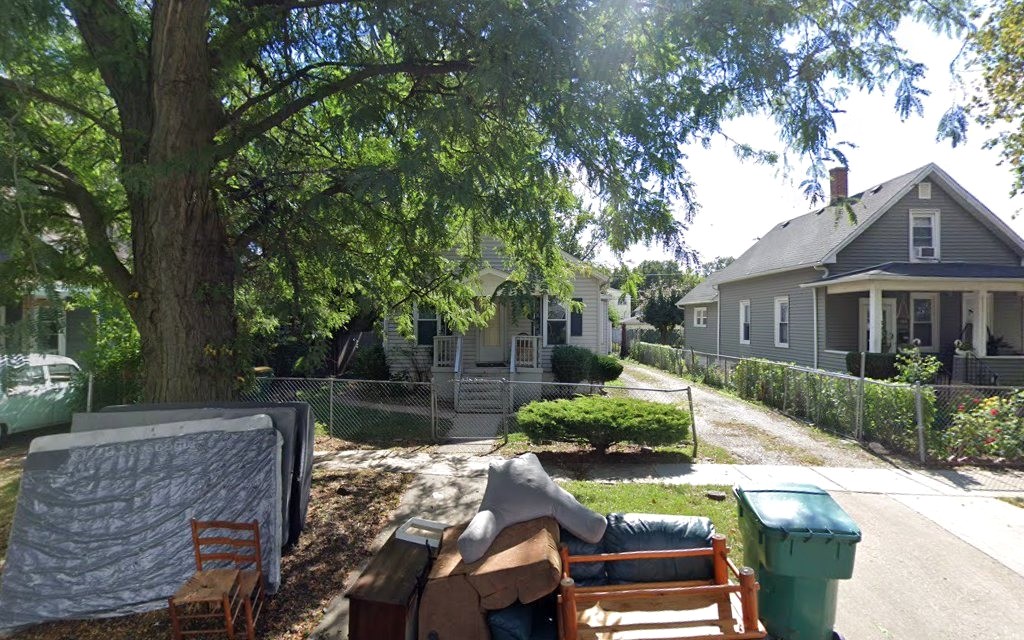
608 Fox Street, 824 Hague Street and 420 N Hebbard Street were each verified against a second
independent record. On 824 Hague the parcel number in the county record matched the APN in the sale
record exactly.
What is still open
Public record does not publish a bedroom and bathroom count for 724 Chase Avenue, and no interior
inspection has been made. The condition adjustment in this analysis is the one figure that a walkthrough
could move, in either direction.
The property
724 Chase Avenue
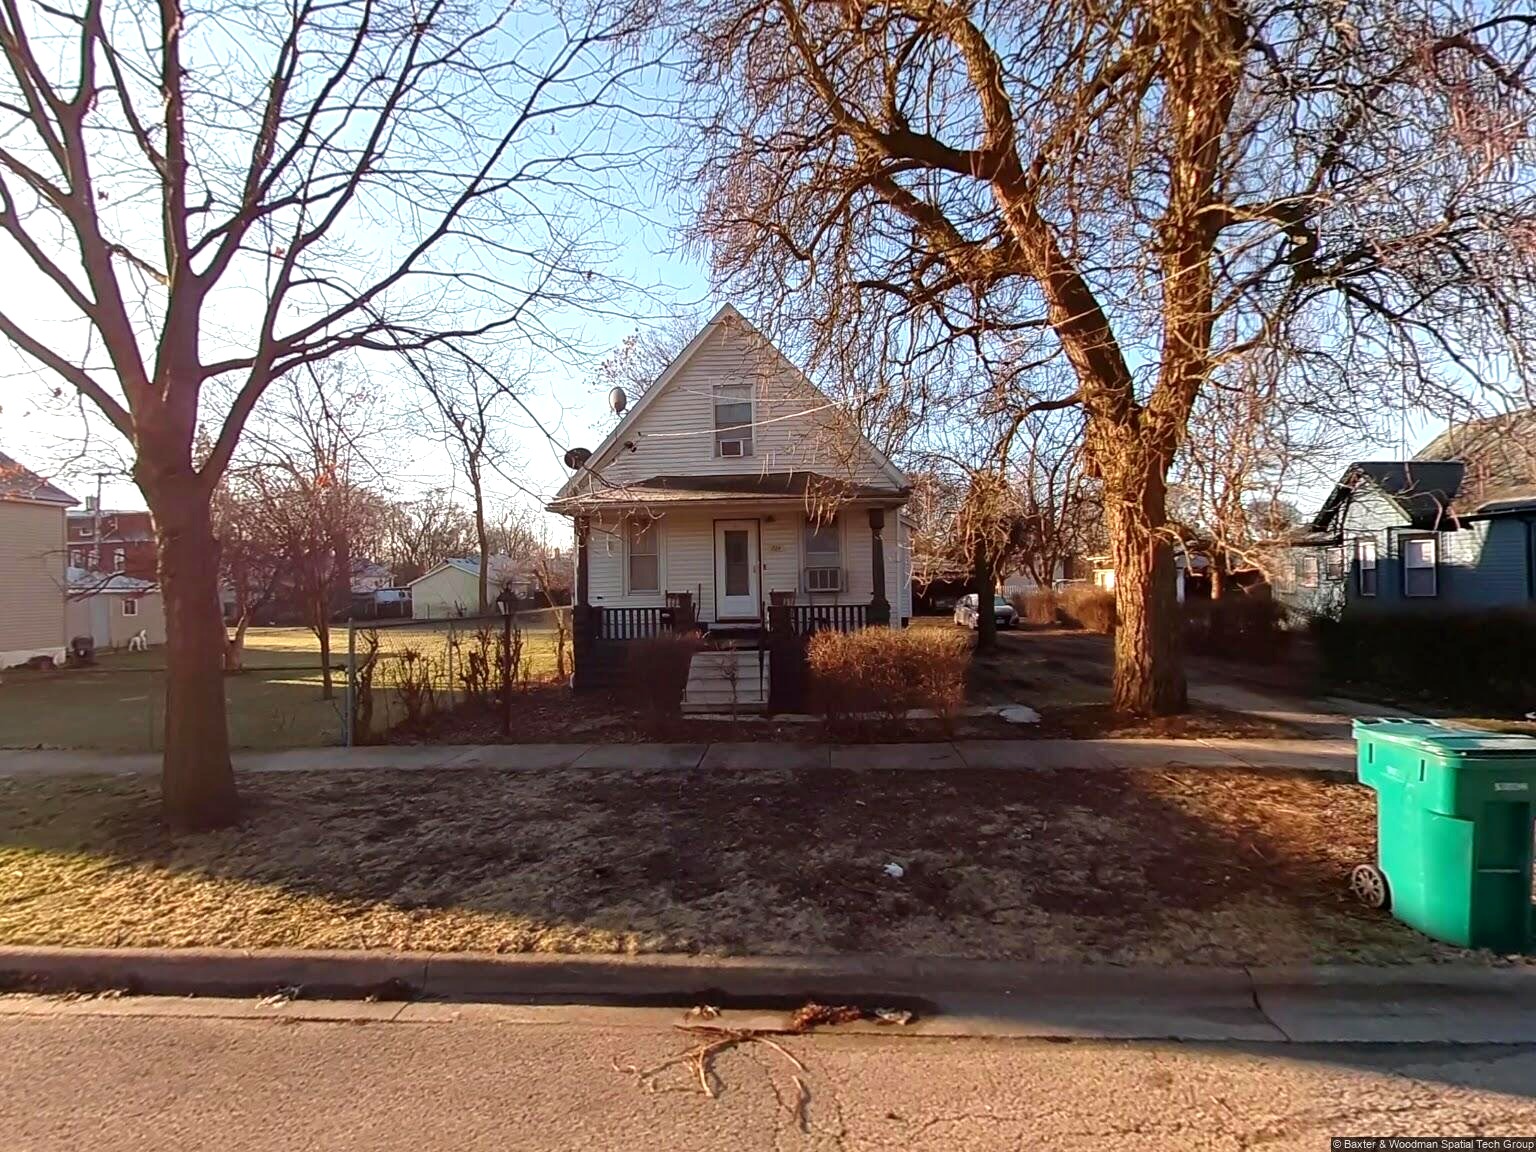
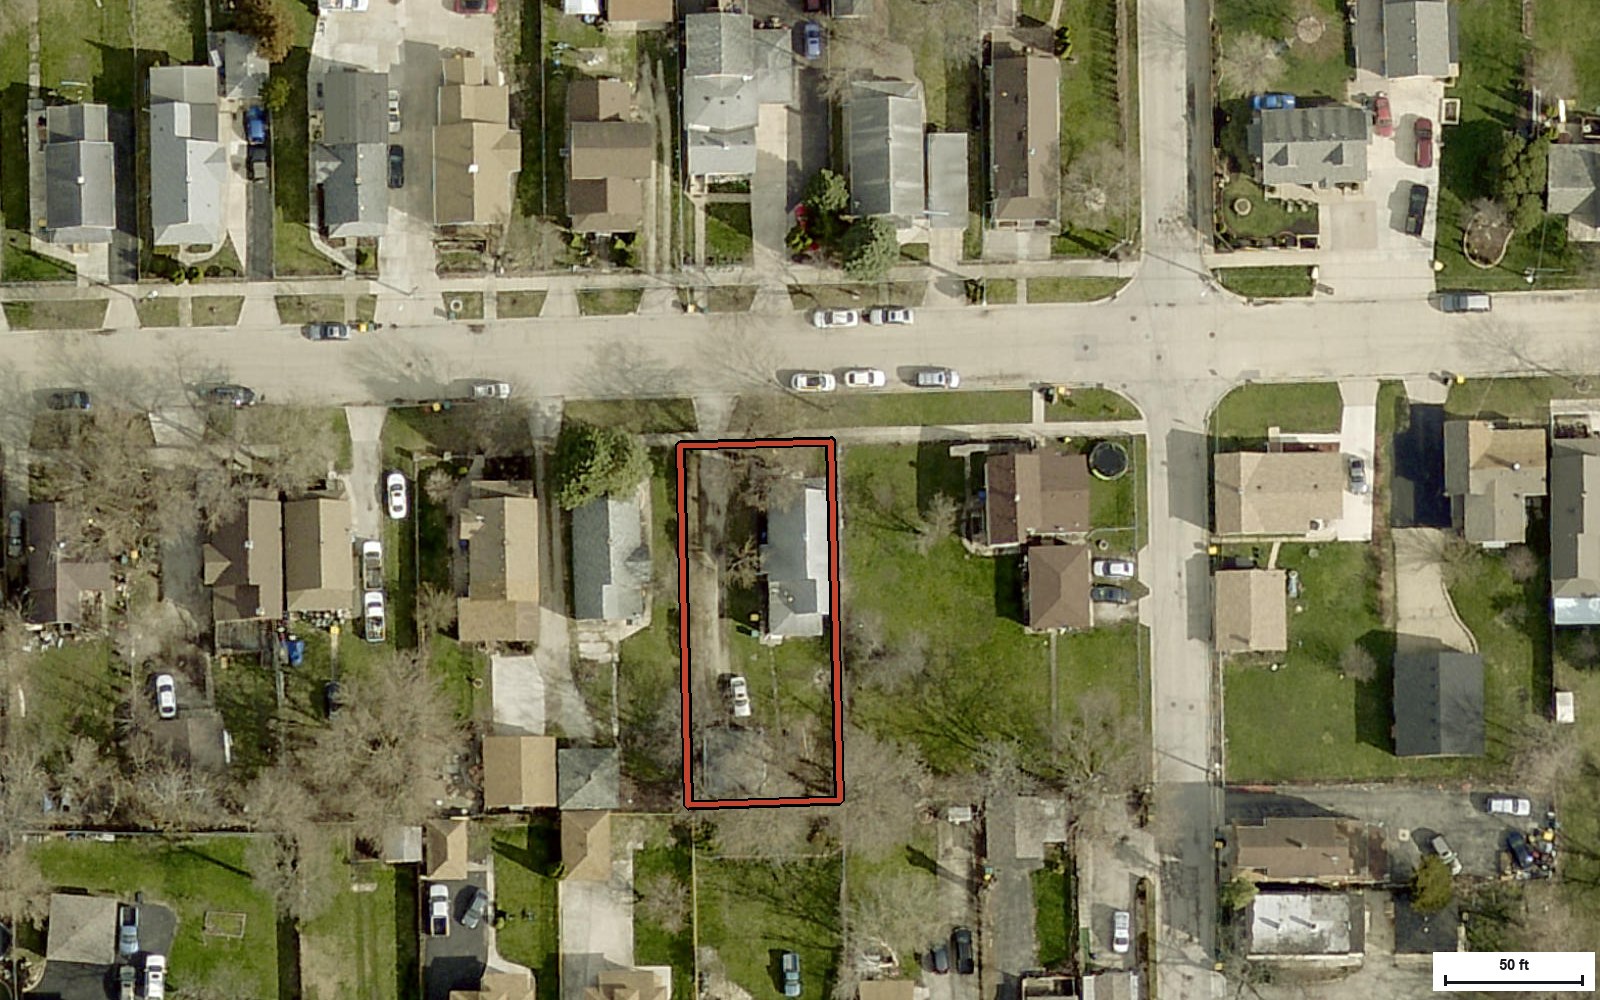
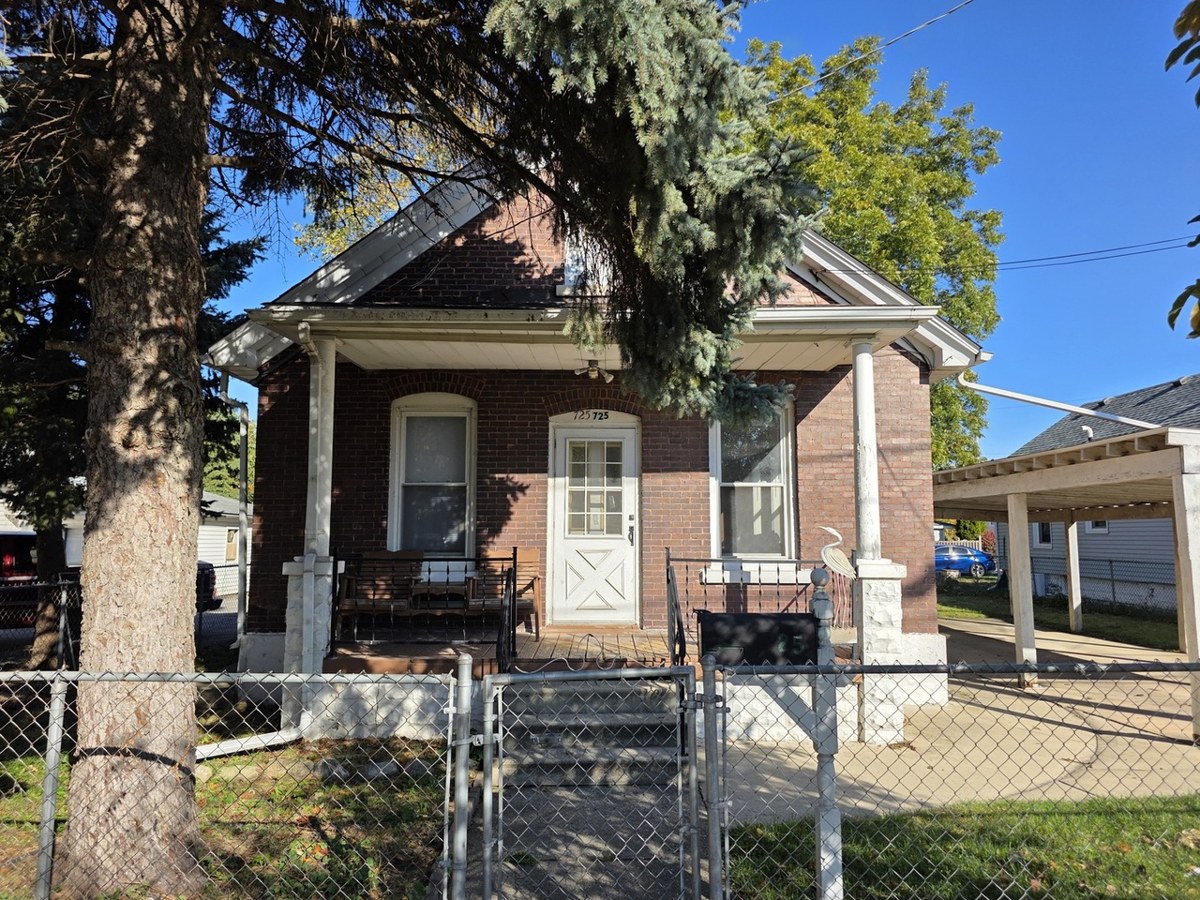
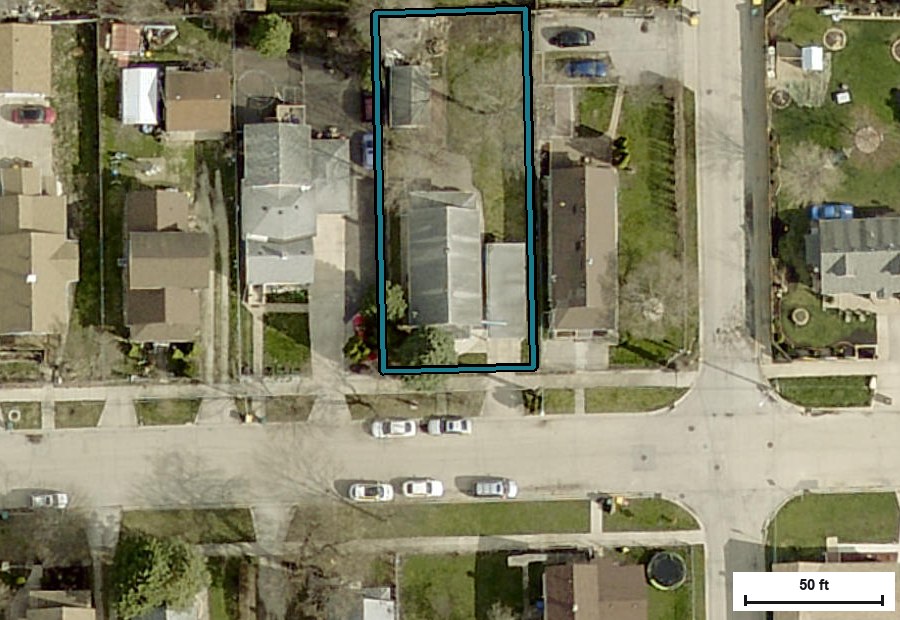
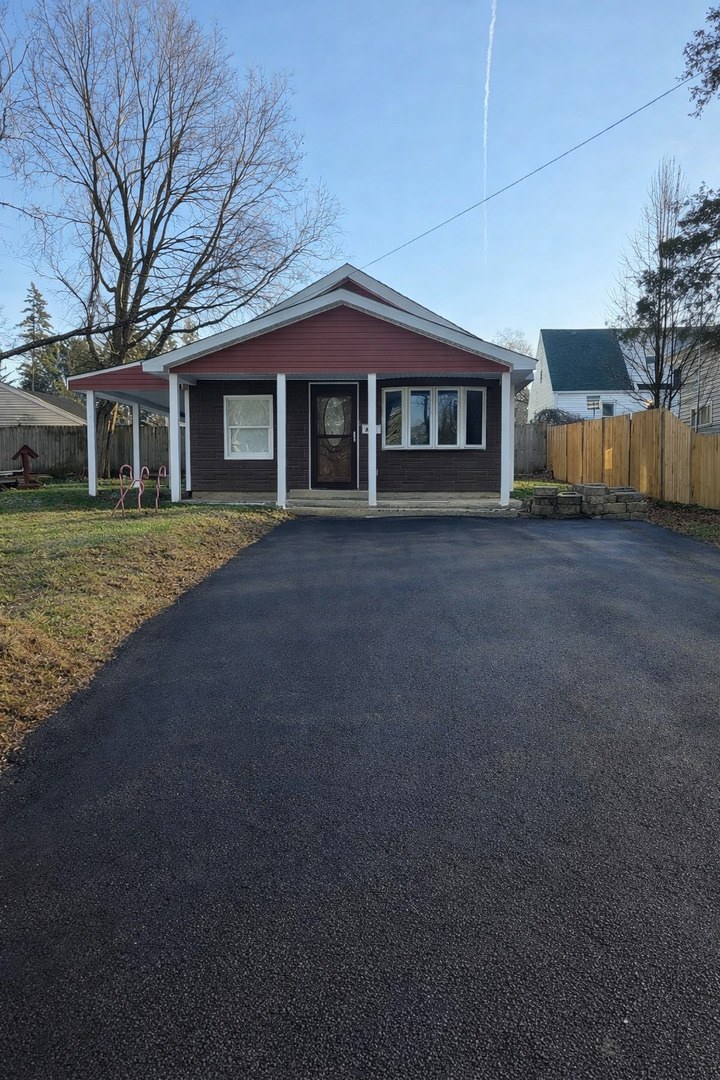
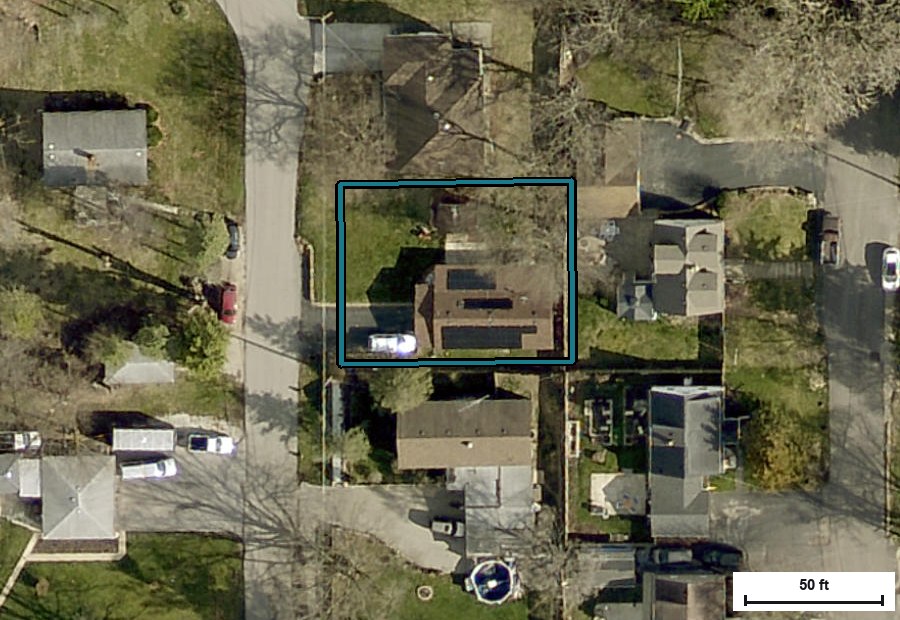
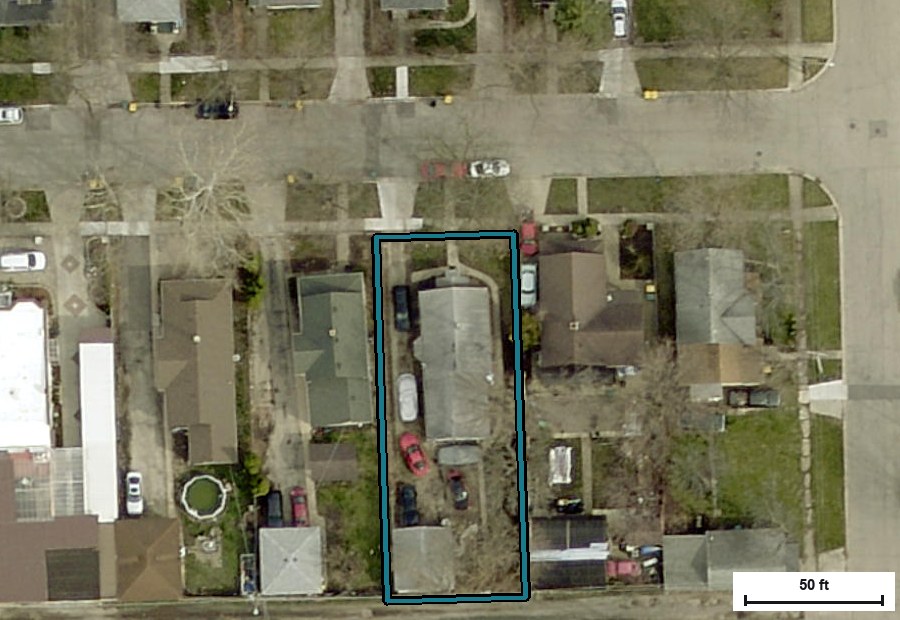
The house from Chase Avenue. Covered front porch, detached garage at the rear.Parcel boundary from the Will County GIS layer. The house sits forward on the lot,
leaving a deep open rear yard. Imagery: Esri World Imagery.
Public record
Parcel number
30-07-03-427-008-0000
Living area
948 sq ft
Year built
1901
Lot area — measured
7,283 sq ft
Lot dimensions
55.1 ft x 131.4 ft
Flood zone
ZONE AE
Confirmed by the owner
Bedrooms and baths
4 bed, 1 bath
Basement
Full, unfinished
Layout
Living room and kitchen on the same level, bedrooms upstairs, small attic above
Garage
Detached garage at the rear
Driveway
Gravel
Rear yard
Grass
Mortgage
Paid off
Four bedrooms beats every comparable
Every closed sale in the core set is a two or three bedroom. A four bedroom reaches a wider pool of
buyers searching by bedroom count, even at 948 sq ft.
The fence is not ours
The fencing around the property belongs to the neighbour. It stays with their parcel, and the listing
should say so plainly rather than let a buyer assume it conveys.
The basement and garage count
A full basement and a detached garage both carry value, and both cancel deductions that would otherwise
be taken against comparables that have them.
Four bedrooms in 948 sq ft
The rooms are small. Marketed as a four bedroom it reaches more searches; an appraiser will price the
square footage, not the room count. Both things are true and the pricing here assumes both.
Living area, year built and parcel data are as published in public
record and measured by county GIS. Bedroom count, basement, garage, driveway, fencing and mortgage status are
as confirmed by the owner. A prior analysis circulated on this property listed the lot at approximately
7,648 sq ft; the county parcel layer measures it at 7,283 sq ft.
The land
Nobody nearby is selling this much land.
The house that closed at $195,000 sits on 4,602 sq ft.
The house asking $205,000 right now sits on 1,950 sq ft.
724 Chase Avenue has 7,283.
Versus the highest price per sq ft sale
+58%
More land than 608 Fox Street, which closed at $261 per sq ft of house.
Versus the closest size match
+30%
More land than 824 Hague Street, which closed at $205,000.
Versus the closest active listing
3.7×
The land under 330 Harwood Street, currently asking $205,000.
The block
The most useful sale in Joliet happened across the street.
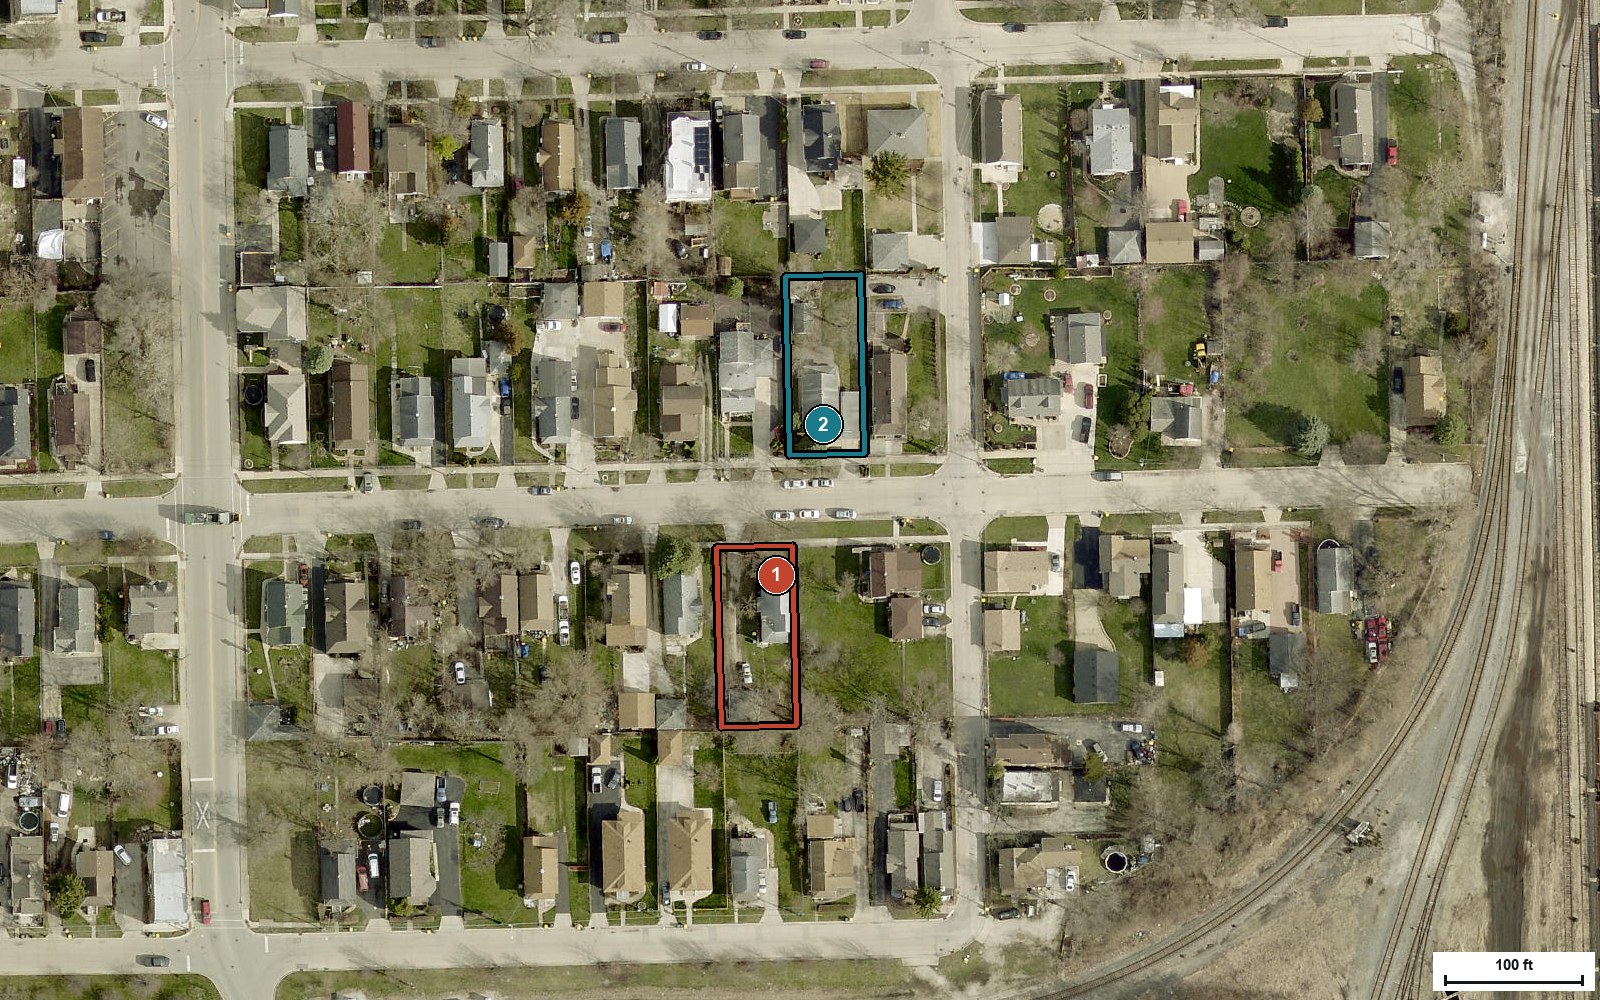
725 Chase Avenue closed on 2026-04-03 at $188,500. Same street, same
block, same floodplain, and a lot within 53 sq ft of identical. It is
112 sq ft smaller than 724 Chase Avenue.
724 Chase Avenue outlined in red, 725 Chase Avenue in teal. Imagery: Esri World Imagery.
724 Chase
725 Chase
Living area
948 sq ft
836 sq ft
Lot area
7,283 sq ft
7,230 sq ft
Year built
1901
1900
Flood zone
ZONE AE
ZONE AE
Condition
Original
Roof 2020, floors 2023
Result
To be determined
$188,500
What separates them
Not size, not land, not location, not flood risk. Only condition — and the belongings still inside.
That is the entire gap, and it is the one thing that can be changed before listing.
Comparable sales
Everything that sold nearby, side by side.
Six closed sales and two active listings. Sale prices and dates come from MLS-distributed
records; lot area, parcel number, flood zone and distance were each verified independently against
county and federal sources.
Property
Closed
Price
Sq ft
$/sq ft
Lot sq ft
Built
Bd/Ba
Flood
Distance
1724 Chase Ave
—
—
948
—
7,283
1901
—
ZONE AE
—
2725 Chase Ave
2026-04-03
$188,500
836
$225
7,230
1900
3/1
ZONE AE
0.02 mi
3418 Irving St
2026-07-09
$146,500
1,096
$134
6,715
1890
3/1
ZONE X
0.54 mi
4704 Francis St
2026-05-21
$172,500
1,001
$172
6,619
1900
2/1
ZONE AE
0.14 mi
5608 Fox St
2026-06-29
$195,000
748
$261
4,602
1910
2/1
ZONE X
1.50 mi
6420 N Hebbard St
2026-06-02
$200,000
884
$226
6,165
1929
2/1
ZONE X
0.90 mi
7824 Hague St
2026-05-20
$205,000
924
$222
5,587
1950
2/1
ZONE X
0.75 mi
A330 Harwood St
For sale
$205,000
1,000
$205
1,950
—
3/1
ZONE X
1.11 mi
B422 Francis St
For sale
$204,900
n/p
—
9,379
—
4/2
ZONE X
0.41 mi
Closed price range
$146k–$205k
Across the six sales.
Price per sq ft range
$134–$261
A wide spread, driven almost entirely by condition.
Closest in size
824 Hague
924 sq ft against 948. Closed $205,000.
Closest in every other way
725 Chase
Across the street. Closed $188,500.
The full picture
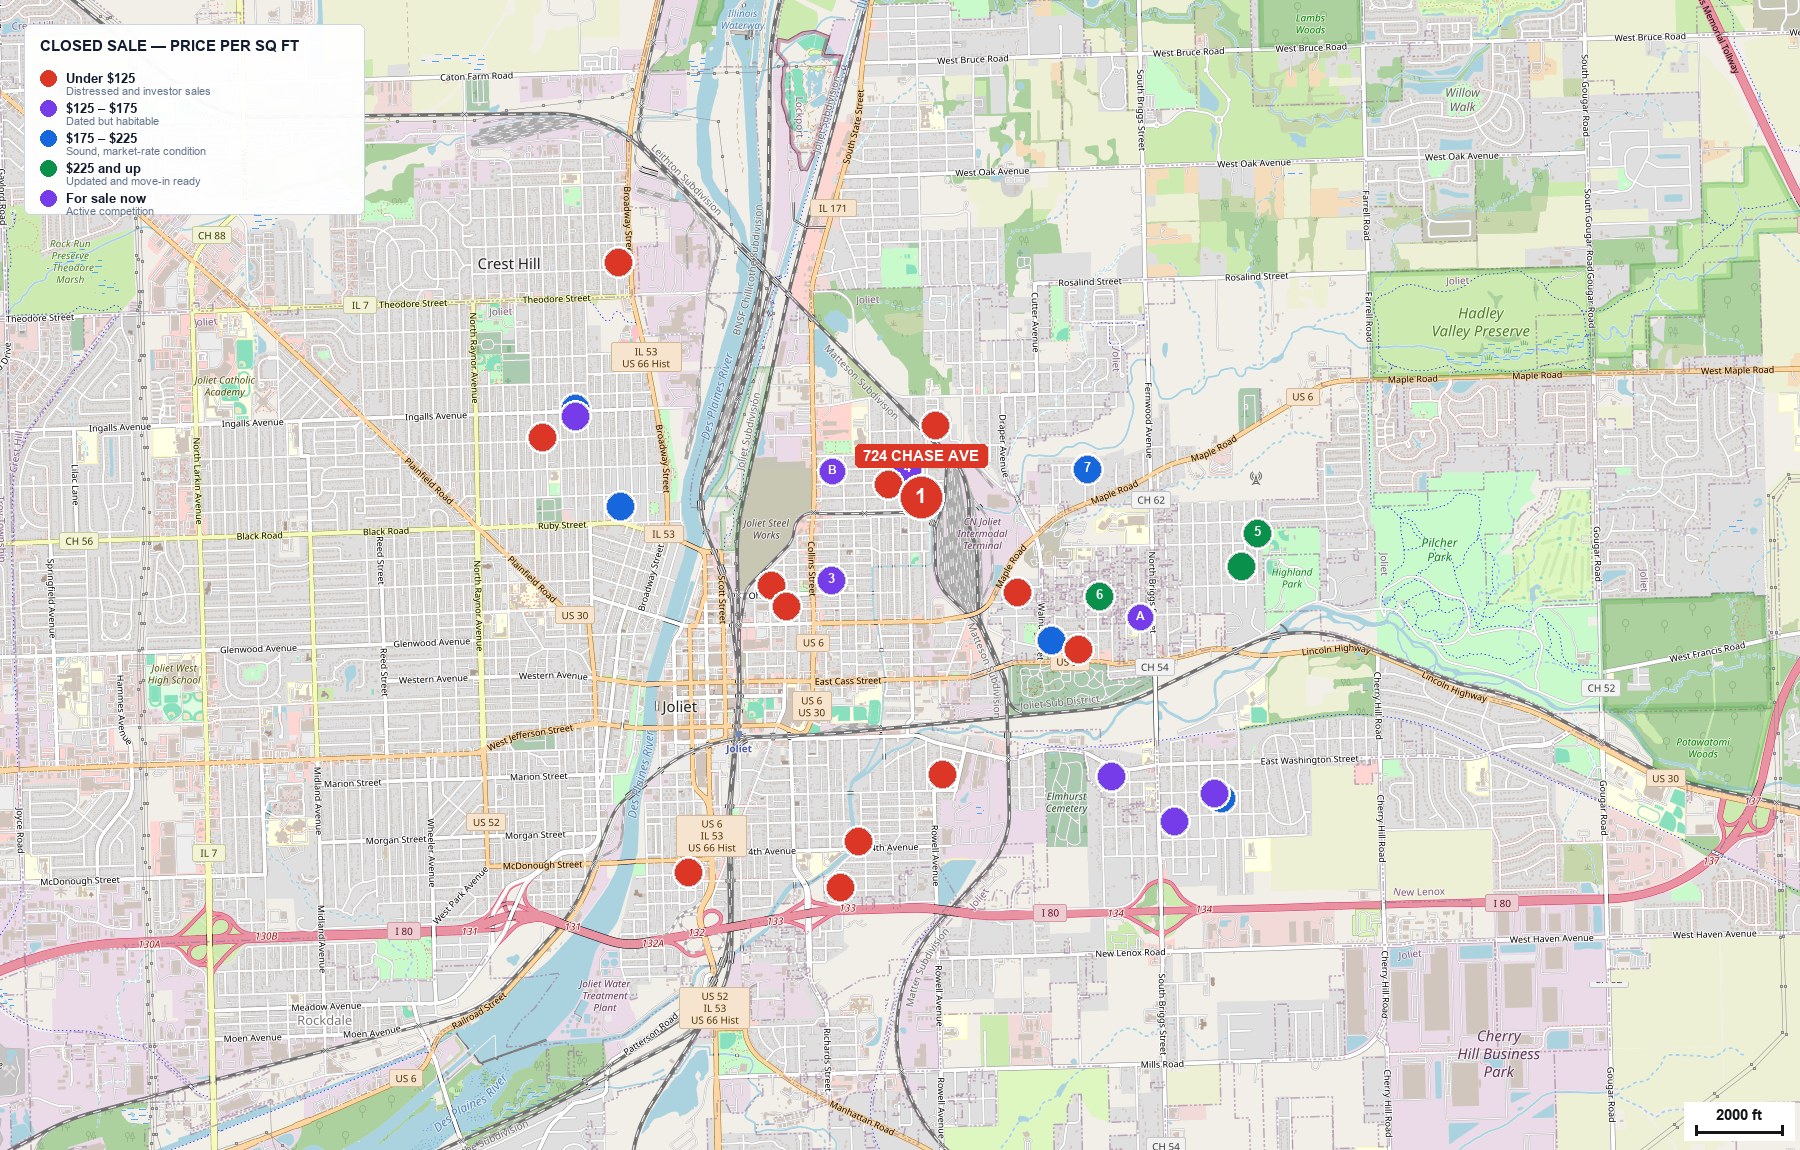
27 sales, not six.
The six comparables on the previous pages are the closest matches. They are not the whole market.
Widening to every sale of a similar-sized house within two miles over the past twelve months shows a market
that splits cleanly in two, and it is the reason a single asking price cannot be argued from six sales alone.
Under $125/sq ft
12
Distressed and investor sales
$125 – $175/sq ft
6
Dated but habitable
$175 – $225/sq ft
5
Sound, market-rate condition
$225/sq ft and up
4
Updated and move-in ready
Median across all 27
$134/sq ft
Half the market sold below this figure.
Bottom of the range
$54/sq ft
Distressed and investor purchases set the floor.
Top of the range
$304/sq ft
Fully updated, move-in ready property.
Source: Redfin closed-sale export for the City of Joliet, filtered to
within 2.0 miles of 724 Chase Avenue by latitude and longitude and to 600–1,400 sq ft of living area. Lot area,
parcel number and flood zone for every property independently verified against Will County GIS and the FEMA
National Flood Hazard Layer.
Where the money actually is
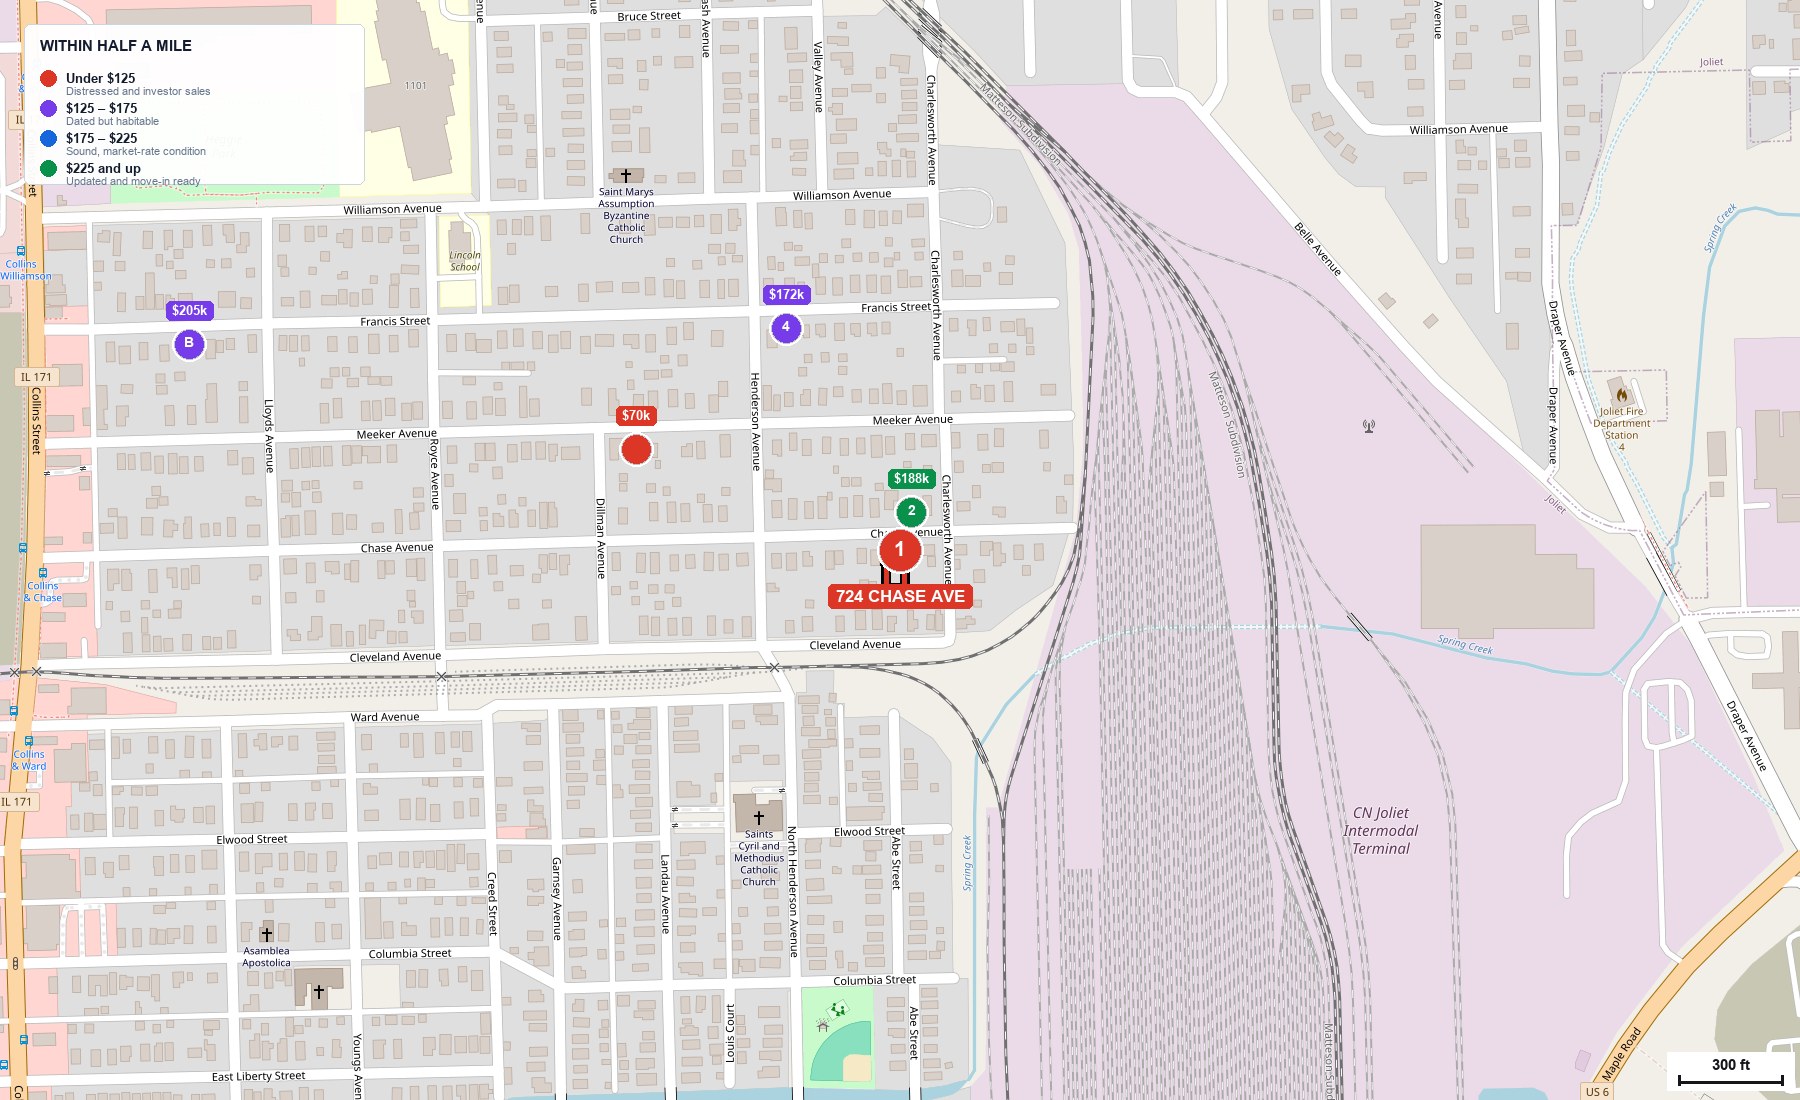
The same street sold for $70,000 and $188,500 in the same year.
654 Meeker Avenue sits 0.16 miles from 724 Chase Avenue, has 924 sq ft against the subject's
948, sits in the same Zone AE floodplain, and closed at $70,000. 725 Chase Avenue, directly
across the street, closed at $188,500. Condition is the whole difference.
Within half a mile. Each dot coloured by price per square foot. Base map: OpenStreetMap.The full two-mile study area, same colour scale.
Red is the risk
Sales under $125 per sq ft cluster tightly around the subject. Priced or presented wrong, this
house joins them.
Green is the target
Every green dot was an updated, move-in ready property. That is what the clean-out buys a share of.
Purple is the competition
The two properties for sale right now, both asking about $205,000.
The evidence table
Every sale behind the recommendation.
Six core comparables plus 21 additional sales of similar-sized houses within two miles.
Colour on the price-per-square-foot column matches the map and the distribution chart throughout this deck.
Property
Closed
Price
Sq ft
$/sq ft
Lot sq ft
Flood
Distance
Role
2725 Chase Ave
2026-04-03
$188,500
836
$225
7,230
ZONE AE
0.02 mi
Core comparable
3418 Irving St
2026-07-09
$146,500
1,096
$134
6,715
ZONE X
0.54 mi
Core comparable
4704 Francis St
2026-05-21
$172,500
1,001
$172
6,619
ZONE AE
0.14 mi
Core comparable
5608 Fox St
2026-06-29
$195,000
748
$261
4,602
ZONE X
1.50 mi
Core comparable
6420 N Hebbard St
2026-06-02
$200,000
884
$226
6,165
ZONE X
0.90 mi
Core comparable
7824 Hague St
2026-05-20
$205,000
924
$222
5,587
ZONE X
0.75 mi
Core comparable
654 Meeker Ave
Past 12 mo
$70,000
924
$76
6,458
ZONE AE
0.16 mi
Wider market
1017 Woodward Ave
Past 12 mo
$90,000
836
$108
3,421
ZONE X
0.33 mi
Wider market
456 Thayer Ave
Past 12 mo
$110,000
1,155
$95
6,807
ZONE X
0.60 mi
Wider market
450 N Eastern Ave
Past 12 mo
$60,000
768
$78
3,406
ZONE X
0.77 mi
Wider market
508 Franklin St
Past 12 mo
$105,000
864
$122
4,754
ZONE AE
0.77 mi
Wider market
251 Leach Ave
Past 12 mo
$197,000
880
$224
5,705
ZONE X
0.86 mi
Wider market
1307 E Jackson St
Past 12 mo
$90,000
1,169
$77
67,200
ZONE X
0.97 mi
Wider market
130 Arizona Ave
Past 12 mo
$70,000
748
$94
5,011
ZONE X
1.23 mi
Wider market
814 Elizabeth St
Past 12 mo
$150,000
672
$223
3,854
ZONE X
1.34 mi
Wider market
513 Pontiac St
Past 12 mo
$190,000
624
$304
4,435
ZONE X
1.46 mi
Wider market
109 White Ave
Past 12 mo
$175,000
1,008
$174
5,246
ZONE X
1.50 mi
Wider market
359 Wilson Ave
Past 12 mo
$83,000
876
$95
6,120
ZONE AE
1.55 mi
Wider market
1124 Vine St
Past 12 mo
$150,000
1,120
$134
5,066
ZONE X
1.58 mi
Wider market
1200 Dearborn St
Past 12 mo
$183,000
1,008
$182
6,171
ZONE X
1.59 mi
Wider market
1101 Highland Ave
Past 12 mo
$108,000
1,172
$92
7,562
ZONE X
1.70 mi
Wider market
1704 N Hickory St
Past 12 mo
$110,000
1,176
$94
6,292
ZONE X
1.70 mi
Wider market
415 Strong Ave
Past 12 mo
$120,000
976
$123
8,595
ZONE X
1.77 mi
Wider market
304 Davison St
Past 12 mo
$164,900
1,116
$148
6,733
ZONE X
1.83 mi
Wider market
200 Barr Elms Ave
Past 12 mo
$160,000
988
$162
10,970
ZONE X
1.85 mi
Wider market
207 Anderson Ave
Past 12 mo
$210,000
1,020
$206
5,002
ZONE X
1.89 mi
Wider market
55 Munroe St
Past 12 mo
$50,000
918
$54
3,334
ZONE AE
1.96 mi
Wider market
Closed dates on the wider set are suppressed in the source export under
MLS display rules; each is confirmed to have closed within the trailing twelve months. Prices, living area,
parcel and flood data are published in full.
Price per square foot
Small houses here trade between $172 and $226 a foot.
Among the houses closest in size to 724 Chase Avenue, the ones in sound condition all closed
above $200 per square foot: 725 Chase Ave at $225, 420 N Hebbard St at $226, 824 Hague St at $222. The recommendation of $184,900 works out to
$195 per foot — deliberately below that band, because this house will not
show like they did.
Why the recommendation sits under the band
724 Chase Avenue is in the floodplain, it is the oldest structure in the set at 1901,
and it has not been updated. Those are real deductions and they are taken in full on the next pages.
Pricing under the band is what makes the number defensible to an appraiser.
Size against price
Bigger did not mean more money — condition did.
The two largest houses in this study sold for the two lowest prices. 418 Irving Street has
1,096 sq ft and closed at $146,500. 608 Fox Street has
748 sq ft and closed at $195,000. The difference between them
was never square footage.
What this means for pricing
Because size does not drive price in this market segment, a square-foot calculation alone will
mislead. The adjustment grid that follows prices condition explicitly rather than burying it.
What this means for the family
Condition is the lever that moves the number here, and condition is the one variable a seller
controls. That is unusually good news.
The finding that changes the comparison
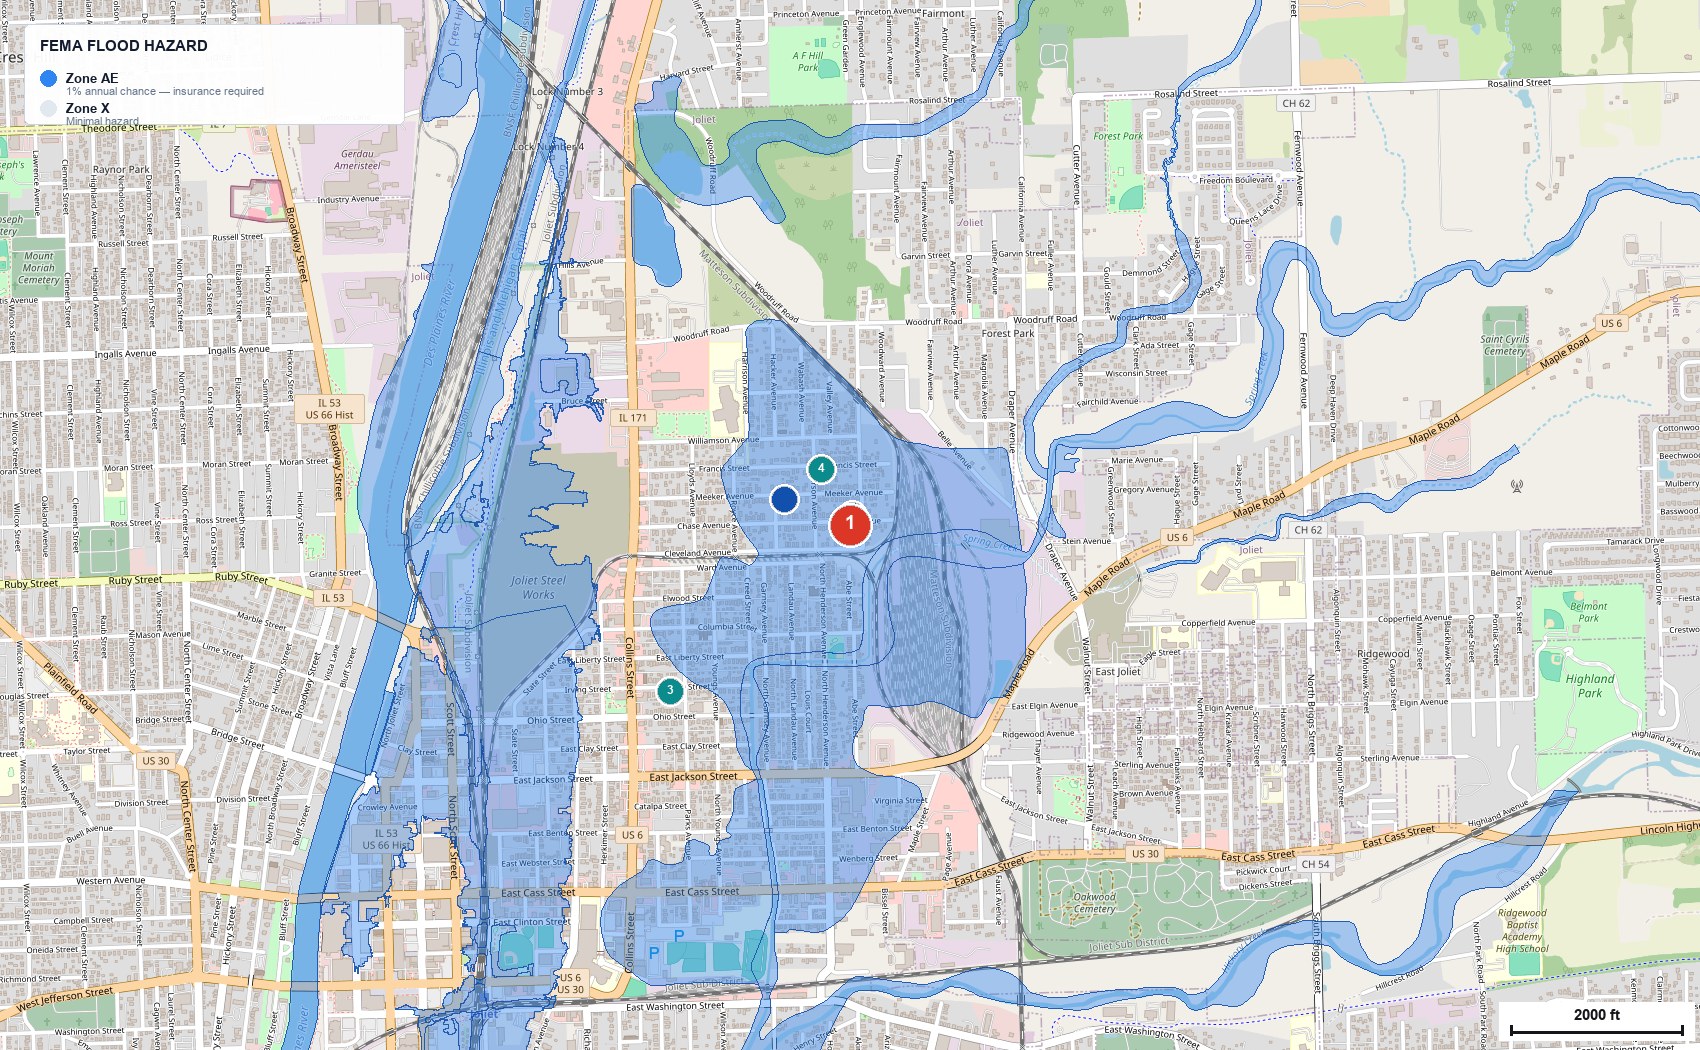
724 Chase Avenue is inside a FEMA Special Flood Hazard Area.
The entire parcel falls in Zone AE — the one percent annual chance floodplain. Any buyer using
a mortgage will be required to carry flood insurance. Four of the six houses used as comparables are not in
that zone at all, which means they were never carrying that cost.
Only two closed sales share the subject's flood status
725 Chase Ave — closed $188,500 at $225 per sq ft, 0.02 mi away
704 Francis St — closed $172,500 at $172 per sq ft, 0.14 mi away
Outside the floodplain, and therefore adjusted
418 Irving St — $146,500
608 Fox St — $195,000
420 N Hebbard St — $200,000
824 Hague St — $205,000
Each of these carries an $8,000 deduction
in the grid to account for the flood-insurance burden the subject carries and they do not.
FEMA National Flood Hazard Layer over the subject neighborhood. Blue is Zone AE.
Verified by intersecting the parcel polygon directly — the whole lot is inside the zone.
Handled properly, this is a manageable disclosure
725 Chase Avenue sold for $188,500 inside the same zone, on the same block,
six months ago. The market has already absorbed this. What it requires is an elevation certificate and a
flood-insurance quote ready on day one, so a buyer never has to guess at the cost.
The adjustment grid
Each sale, corrected line by line to this property.
A list of raw sale prices is not a valuation. This grid takes every closed sale and adjusts it
for the ways it differs from 724 Chase Avenue. A positive figure means the comparable was inferior and its
price is raised; a negative figure means it was superior and its price is lowered.
Comparable
Sold
Size
Land
Beds
Storey
Age
Flood
Contents
Condition
Other
Adjusted
Weight
2725 Chase Ave
$188,500
+8,400
+106
—
—
−6,000
−20,000
—
$169,506
35%
3418 Irving St
$146,500
−11,100
+1,136
+1,000
−8,000
−6,000
+15,000
—
$141,036
5%
4704 Francis St
$172,500
−3,975
+1,328
—
—
−6,000
—
—
$168,853
15%
5608 Fox St
$195,000
+15,000
+5,362
−1,000
−8,000
−6,000
−15,000
−5,000
$185,362
10%
6420 N Hebbard St
$200,000
+4,800
+2,236
−3,000
−8,000
−6,000
−6,000
—
$185,036
20%
7824 Hague St
$205,000
+1,800
+3,392
−5,000
−8,000
−6,000
−18,000
—
$178,192
15%
Size
$75 per sq ft of difference in living area.
Land
$2 per sq ft of difference in measured lot area.
Flood
$8,000 against any comparable outside the floodplain.
Contents
$6,000 for selling with belongings still in place.
Age is adjusted at $1,000 per decade of difference in year built.
Condition and the "other" column are the only judgement-based lines; each is explained on the comparable's own
page. Weights reflect how closely each sale matches the subject on street, floodplain, size and condition.
Worked example
How $188,500 across the street becomes $169,506 here.
Living area +8,400
724 Chase Avenue is 112 sq ft larger, at $75 a foot.
Lot +106
Effectively identical land — 7,283 sq ft against 7,230.
Contents −6,000
725 Chase Avenue was delivered empty. This is the line the family can erase.
Condition −20,000
Roof replaced 2020, kitchen flooring 2023; subject is original throughout.
Read the last two columns again
Together, contents and condition take $26,000 off the value of
this house. Neither one is about location, land or size. Both are reversible.
The first question anyone will ask
Why we are not asking more than the house across the street.
725 Chase Avenue sold for $188,500 in April. It is a single-storey brick ranch
with a roof from 2020 and flooring from 2023. Anyone reading this will put the two houses side by side, and
the asking price has to survive that comparison on the first look.
724 Chase
725 Chase
Sold or asking
$184,900
$188,500
Living area
948 sq ft
836 sq ft
Bedrooms
4
3
Basement
Full, unfinished
Not recorded
Garage
Detached
Not recorded
Layout
Storey and a half
Single-storey ranch
Roof
Original
Replaced 2020
Flooring
Original
Renovated 2023
Lot
7,283 sq ft
7,230 sq ft
Where 725 Chase wins
It is updated and it is a ranch. A single-storey house reaches older buyers, buyers with mobility
needs and buyers who simply do not want stairs. That is a wider pool, and this analysis now carries a
$4,000 deduction for it against every single-storey comparable.
Where 724 Chase wins
112 more square feet, an extra bedroom, a full basement and a detached garage.
Real value, but none of it shows in a photograph the way a new floor does.
How that resolves
The size, bedroom and land advantages add about $11,006.
Condition and the ranch layout take about $24,000 back off.
Condition wins.
Which is why the recommendation is
$184,900
$3,600 below the updated ranch across the street,
on a cleared-out house with more space, more bedrooms, a basement and a garage
Asking above $188,500
No
It fails the first comparison a buyer makes, and an appraiser has the same sale in front of them.
Cleared-out supported value
$183,000–$186,000
Sits under 725 Chase, which is where it belongs.
The honest ceiling
$188,500
Beating it requires actually updating the house, not just emptying it.
An earlier draft of this analysis carried a higher figure. It credited
a clean-out with recovering part of the condition gap, which a clean-out cannot do. Emptying a house changes
how it photographs and how it shows. It does not replace a roof or a floor, and the number has been corrected
to reflect that.
Reconciliation
Six answers, weighted into one.
The adjusted values run from $141,036 to $185,362. Weighting each sale by
how closely it matches 724 Chase Avenue produces an as-is basis of $174,000 — the value of this house
sold exactly as it stands today.
Unweighted average
$171,331
Treating all six sales equally, including the renovation project.
Weighted as-is basis
$174,000
The figure used throughout the rest of this analysis.
After clean-out
$183,000–$186,000
The contents deduction removed, plus the benefit of photographing an empty house.
Comparable detail 1
The three sales that matter most.
Closest on street, closest on size, and the one that proves an as-is sale can beat its asking price.
2725 Chase Ave
$188,500
Closed
2026-04-03
Size / lot
836 sq ft on 7,230
Per sq ft
$225
Built / beds
1900 · 3bd 1ba
Flood / distance
AE · 0.02 mi
Adjusted to subject
$169,506
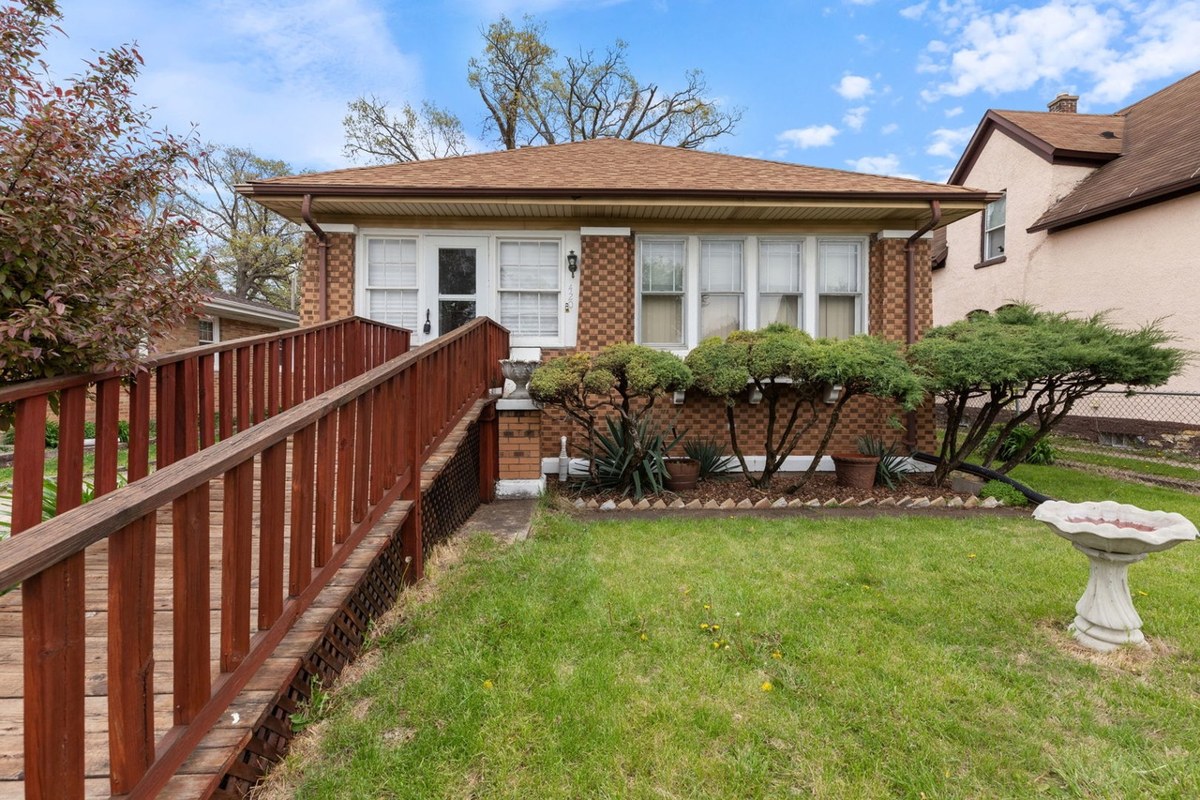
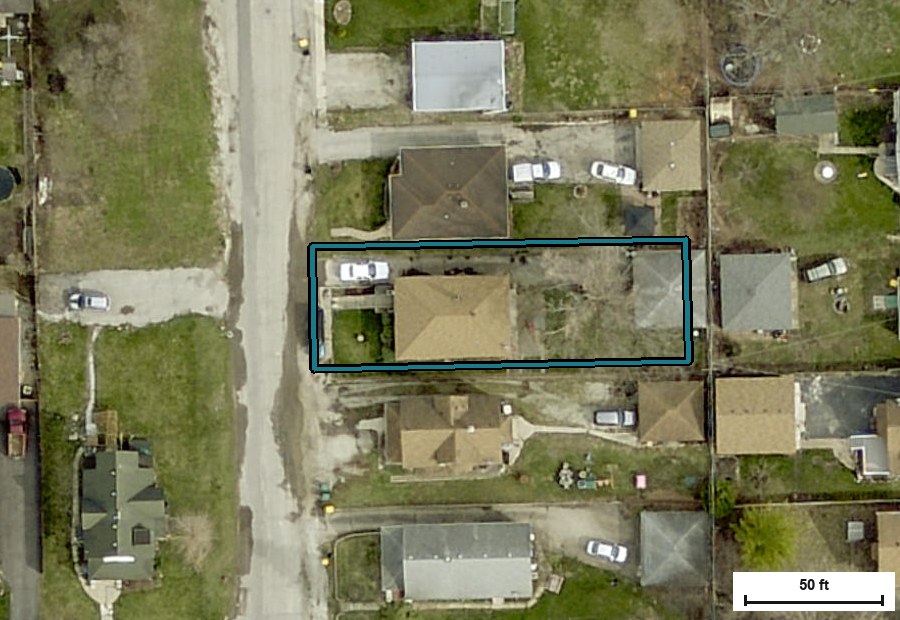
Directly across the street. Single-storey brick ranch, fully fenced yard. Kitchen flooring renovated 2023, roof 2020.
7824 Hague St
$205,000
Closed
2026-05-20
Size / lot
924 sq ft on 5,587
Per sq ft
$222
Built / beds
1950 · 2bd 1ba
Flood / distance
X · 0.75 mi
Adjusted to subject
$178,192
Closest living-area match in the set (924 sq ft vs 948). Solar panels. 2024 taxes $3,591.80 on a $50,883 assessment. Sold on a lot 23% smaller than the subject's.
6420 N Hebbard St
$200,000
Closed
2026-06-02
Size / lot
884 sq ft on 6,165
Per sq ft
$226
Built / beds
1929 · 2bd 1ba
Flood / distance
X · 0.90 mi
Adjusted to subject
$185,036
THE AS-IS BENCHMARK. Explicitly marketed and sold as-is with newer mechanicals and a full unfinished basement — and still closed $20,000 OVER its $180,000 list price.
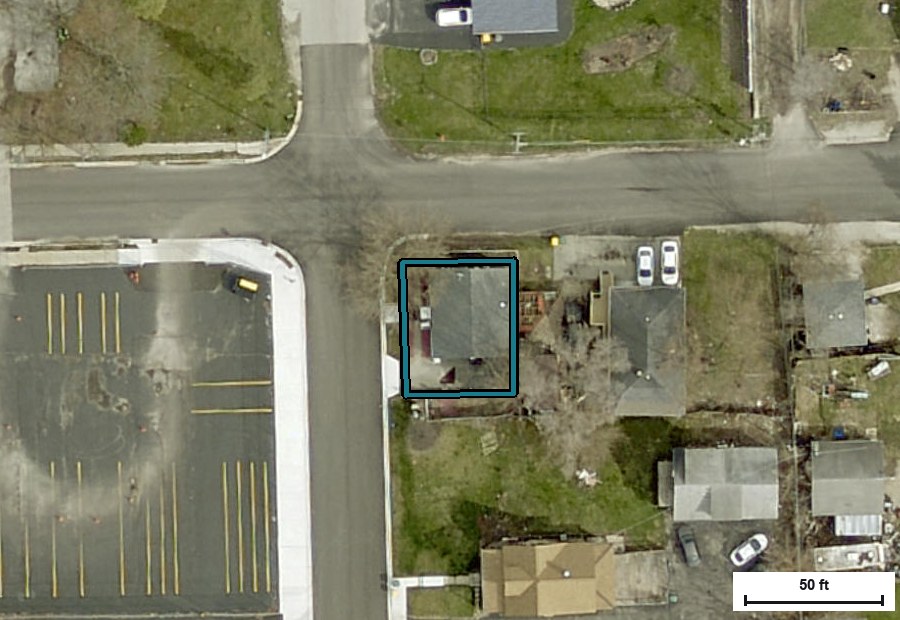
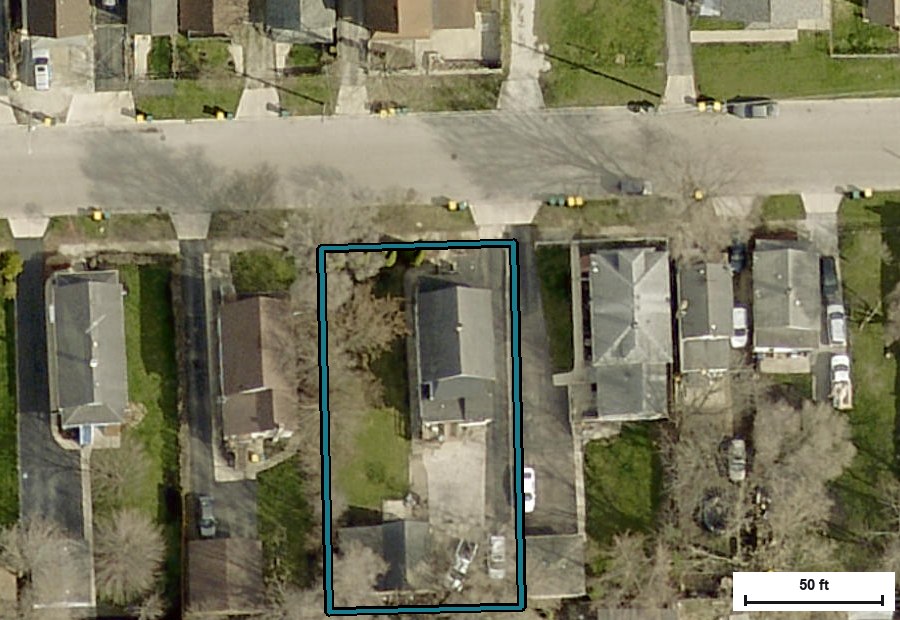
Street photographs are the marketing images published with each
listing when it sold, except 418 Irving Street, which is Google Street View. Aerial imagery: Esri World
Imagery. Parcel outlines from the Will County GIS layer.
Comparable detail 2
The three that set the outer edges.
The highest price per square foot, the second floodplain sale, and the renovation project that marks the floor.
5608 Fox St
$195,000
Closed
2026-06-29
Size / lot
748 sq ft on 4,602
Per sq ft
$261
Built / beds
1910 · 2bd 1ba
Flood / distance
X · 1.50 mi
Adjusted to subject
$185,362
Highest price per sq ft in the set on the smallest lot in the set. Central air, crawl space, gravel parking. 2024 taxes $2,786. Sits 1.5 miles away in a different submarket.
4704 Francis St
$172,500
Closed
2026-05-21
Size / lot
1,001 sq ft on 6,619
Per sq ft
$172
Built / beds
1900 · 2bd 1ba
Flood / distance
AE · 0.14 mi
Adjusted to subject
$168,853
Second of only two closed sales inside the same Zone AE floodplain as the subject. Closed 1.4% under list.
3418 Irving St
$146,500
Closed
2026-07-09
Size / lot
1,096 sq ft on 6,715
Per sq ft
$134
Built / beds
1890 · 3bd 1ba
Flood / distance
X · 0.54 mi
Adjusted to subject
$141,036
Marketed to investors and DIY buyers as needing updates, improvements and TLC. Full basement plus garage. Closed 13.8% below the $170,000 list.
Street photographs are the marketing images published with each
listing when it sold, except 418 Irving Street, which is Google Street View. Aerial imagery: Esri World
Imagery. Parcel outlines from the Will County GIS layer.
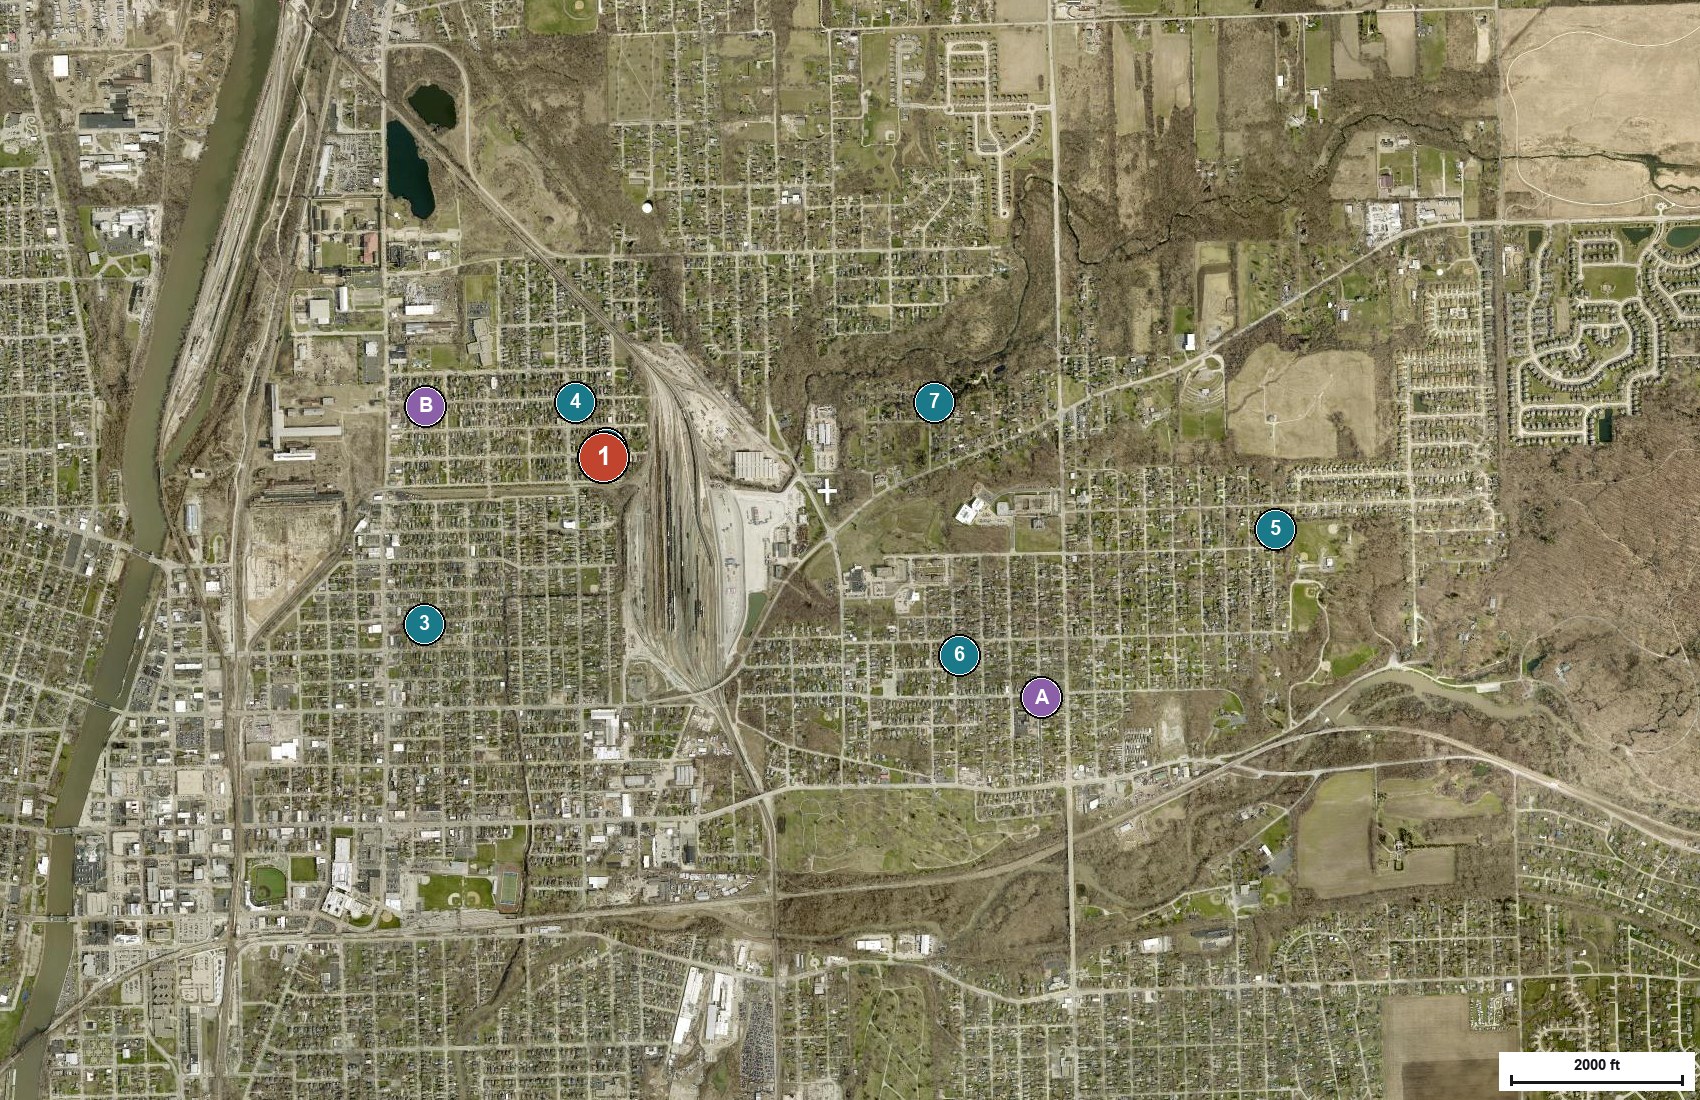
Where they are
Distance matters more than most reports admit.
The highest price per square foot in the study, 608 Fox Street at $261,
sits 1.5 miles away in a different part of Joliet. The most useful sale sits
0.02 miles away — directly across the street.
All nine properties. Red is the subject, teal are closed sales, purple are active listings.The same set over aerial imagery. Imagery: Esri.
Property
Distance
Price
$/sq ft
Flood
Why it matters
2725 Chase Ave
0.02 mi
$188,500
$225
ZONE AE
Directly across the street. Single-storey brick ranch, fully fenced yard. Kitchen flooring renovated 2023, roof 2020.
4704 Francis St
0.14 mi
$172,500
$172
ZONE AE
Second of only two closed sales inside the same Zone AE floodplain as the subject. Closed 1.4% under list.
3418 Irving St
0.54 mi
$146,500
$134
ZONE X
Marketed to investors and DIY buyers as needing updates, improvements and TLC. Full basement plus garage. Closed 13.8% b
7824 Hague St
0.75 mi
$205,000
$222
ZONE X
Closest living-area match in the set (924 sq ft vs 948). Solar panels. 2024 taxes $3,591.80 on a $50,883 assessment. Sol
6420 N Hebbard St
0.90 mi
$200,000
$226
ZONE X
THE AS-IS BENCHMARK. Explicitly marketed and sold as-is with newer mechanicals and a full unfinished basement — and stil
5608 Fox St
1.50 mi
$195,000
$261
ZONE X
Highest price per sq ft in the set on the smallest lot in the set. Central air, crawl space, gravel parking. 2024 taxes
The competition
What a buyer can walk into instead.
Two properties are competing for the same buyer right now, both asking about
$205,000. Neither is a better piece of land than 724 Chase Avenue, and one of them is on a lot a
quarter the size.
A330 Harwood St
$205,000
Status
For sale now
Size
1,000 sq ft
Lot — measured
1,950 sq ft
Beds / baths
3bd 1ba
Flood
X
Distance
1.11 mi
Closest active match on size and configuration — but on a 1,950 sq ft lot, barely a quarter of the subject's land. Sits beside A.O. Marshall Elementary at 319 Harwood.
B422 Francis St
$204,900
Status
For sale now
Size
not published
Lot — measured
9,379 sq ft
Beds / baths
4bd 2ba
Flood
X
Distance
0.41 mi
More bedrooms and baths on a larger irregular lot. Secondary reference only — a different buyer profile.
What the competition tells us about price
Sellers in this ZIP are asking around $205,000 for houses of roughly 1,000 sq ft. With
the recommended list at $184,900, 724 Chase Avenue undercuts both while offering
3.7 times the land of the closest match.
Inventory is thin
Only 17 single-family properties were in
inventory across the whole ZIP in the most recent measured period, against
20 sales. Thin supply is the reason a well-presented house does not sit.
The market, twelve months and beyond
Price per square foot in this ZIP is up 27.5% in a year.
This is the strongest argument in the analysis for not underpricing. The value buyers place on
each square foot in 60432 has climbed from roughly $140 in spring 2025 to
$179 in the most recent measured period.
Median sale price is a noisier series than price per square foot in a
ZIP this small — a handful of larger houses closing in one window moves it sharply, which is what produced the
spring 2026 spike. Price per square foot is the more reliable read.
Three months, six months, twelve months
The market moved while this house sat.
Price per square foot in this ZIP is 6%
higher over the last three months than the twelve-month average. Each window below
is a separate 90-day period, so the three, six and twelve month figures do not double count the same sales.
Window
Median sale price
Median $/sq ft
Sales
Days on market
Sale to list
Inventory
Last 3 months
$229,950
$179
20
62 days
99.8%
17
Last 6 months
$228,725
$184
42
66 days
99.2%
16
Last 12 months
$217,738
$169
92
62 days
99.1%
19
Most recent quarter
$179/sq ft
The number that matters most for a listing going out now.
Twelve-month average
$169/sq ft
The longer baseline an appraiser is likely to reach for.
Subject at $184,900
$195/sq ft
Where the recommendation sits against both.
Source: Redfin Data Center ZIP market tracker. Windows end
31 May 2026, 28 February 2026, 30 November 2025 and 31 August 2025.
Pace and negotiation
Sellers here are getting essentially all of their asking price.
Median days on market
62
Plan the sale around two months, not two weeks.
Sale to list ratio
99.8%
Correctly priced property is closing at asking.
Closed above asking
25%
One sale in four still clears list price.
Sales in the period
20
Against 17 properties in inventory.
What this means for the asking price
A sale-to-list ratio of 99.8% says this market does not reward padding
the number and does not punish a fair one. 420 N Hebbard Street proves the upside: it listed at
$180,000 as-is and closed at $200,000 —
$20,000 over asking.
The decision
Three paths. The middle one is the best trade.
Doing nothing costs nothing and leaves roughly $3,000 to
$8,500 on the table. Full renovation returns more gross value but ties up
$18,000 to $24,000 of the family's money first, and the margin is
thinner than it looks.
Sell exactly as it stands
Contents in place, no preparation
Supported value
$174,000 – $174,000
Cost to get there
No spend
Net gain after cost
—
Expected time to sell
45–75 days
The work
List immediately
Photograph the property occupied
Buyer takes the clean-out
Buyer: Investors and cash flippers Risk: Smallest buyer pool. Photos show belongings, which suppresses showing requests and invites low offers.
Recommended
Clear it out and clean it
Full clean-out, deep clean, professional photography
Supported value
$183,000 – $186,000
Cost to get there
$3,500 – $6,000
Net gain after cost
$3,000 – $8,500
Expected time to sell
30–60 days
The work
Complete clean-out and haul-away
Professional deep clean
Yard cut and edge
Professional photography and floor plan
Buyer: Owner-occupants using conventional financing, plus investors Risk: Low. No construction, no permits, no surprises.
Clear it out and refresh it
Clean-out plus targeted cosmetic work
Supported value
$195,000 – $201,000
Cost to get there
$18,000 – $24,000
Net gain after cost
$-3,000 – $9,000
Expected time to sell
21–45 days
The work
Everything in the clean-out path
Interior paint throughout
Flooring in the main living areas
Light fixtures, outlets and switch plates
Kitchen and bath refresh — surfaces and hardware, not a gut
Buyer: Owner-occupants, the widest and highest-paying pool, plus FHA buyers Risk: Moderate. Requires 4–6 weeks and up-front money before listing.
Why not renovate
The full refresh earns less per dollar than the clean-out.
It is tempting to assume more work means more money. On this house, run the arithmetic to the
end and the clean-out is the better trade — it returns more, faster, with none of the risk.
As it stands
Cleared out
Cleared and refreshed
Supported value, low
$174,000
$183,000
$195,000
Supported value, high
$174,000
$186,000
$201,000
Money spent first
—
$3,500 – $6,000
$18,000 – $24,000
Weeks before it can be listed
0
1 – 2
4 – 6
Net gain over as-is, worst case
—
$3,000
$-3,000
Net gain over as-is, best case
—
$8,500
$9,000
Return per dollar spent
—
1.5× – 3.4×
0.9× – 1.5×
The clean-out wins on return
Roughly 1.5 to 3.4 dollars back for
every dollar spent, against 0.9 to 1.5
for the full refresh.
It wins on risk
No contractors, no permits, no overruns, and nothing that can be discovered behind a wall once the work
has started.
It wins on speed
One to two weeks to market instead of four to six. In a market averaging
62 days to sell, that difference compounds.
If the family would rather not fund even the clean-out, the as-is path
is legitimate and this analysis prices it honestly at $174,000. The recommendation is not that the work
must happen — only that the family should decide it with the numbers in front of them.
The graduated scale
Every price buys a different speed.
Asking price and time to sell are the same decision. The bar on each rung is the share of the
last 27 comparable sales that closed at or above that number, which is the honest measure of how
much of the market can even reach it.
At $189,900
22%
Of recent sales reached this price. It requires the property to show well.
At $169,900
37%
A far larger pool. This is a realistic cleared-out number.
At $149,900
52%
Sells quickly, and gives away roughly $24,100 against the adjusted basis.
Adjusted as-is basis
$174,000
33% of recent sales closed at or above this figure.
Reading this honestly
$189,900 is the top of what the evidence will carry, and only on the refresh path. A cleared-out
house listed between $169,900 and $179,900 sits where the largest share of real buyers
actually transact, and it stays above the adjusted as-is basis of $174,000.
Timing
It is September. The window is closing.
Joliet has a real selling season, and the data shows it plainly. Property that goes to market
in the cold months takes about 15 days longer to sell and closes slightly further under asking.
A clean-out started now lists in early October and catches the tail of the good season.
Selling season
51 days
Median time on market, May through November windows.
Cold months
65 days
December through April windows.
The winter penalty
+15 days
Plus about a point of price on the sale-to-list ratio.
Days to list if started now
14–21
Clean-out, clean, photograph, live.
List by mid-October
The property is empty, photographed in daylight with leaves still on the trees, and in front of buyers
before the holidays.
List in December or January
Photographs show a bare yard and grey light. Showings drop. The house sits, and a stale listing invites
lower offers.
Or wait for spring
A legitimate choice. It costs six months of carrying the property, but the house shows at its best and
the buyer pool is at its widest.
What the family actually keeps
There is no mortgage. Every dollar is equity.
724 Chase Avenue is owned free and clear. There is no payoff to clear at closing, which means
the sale price minus selling costs is what the family keeps. It also means there is no carrying cost forcing
a fast decision, and no lender to satisfy on condition.
Scenario
Sale price
Selling costs (5%)
Closing costs (2%)
Net to the family
Sell as it stands
$174,000
$8,700
$3,480
$161,820
Cleared out, low end
$183,000
$9,150
$3,660
$170,190
Cleared out, high end
$186,000
$9,300
$3,720
$172,980
Existing mortgage
None
Owned free and clear. No payoff at closing.
What that buys
Time
No carrying cost forces a rushed sale. The family can hold for the right offer.
Offer types open
All
Cash, conventional or FHA. With no lender on the sell side, any buyer financing works.
Selling and closing cost percentages are planning figures for Will
County, Illinois and are shown to compare scenarios. Actual figures depend on the contract, the title company
and any negotiated concessions. This is not tax advice.
Recommendation
List at $184,900 once the property is empty.
Recommended list price
$184,900
$195 per square foot ·
supported range $183,000 – $186,000
Why not higher. 725 Chase Avenue, the updated ranch directly across the street, sold for
$188,500. Asking above that invites the comparison and loses it.
Why not lower. At $174,000 the family is funding the buyer's clean-out and handing over
the difference. Every similar-sized sale this year closed above $172 per square foot.
Why this number holds up. $195 per foot sits under the
$172–$226 band for comparable-sized houses, which gives an appraiser
room to support the contract.
If the response is
What it means
The move
Timing
Offers in week one or two
Priced correctly into thin inventory.
Hold the number. Ask for highest and best if more than one offer lands.
Days 1–14
Steady showings, no offers
The price is close but a specific objection is repeating.
Collect the showing feedback and address the objection directly rather than cutting the price.
Days 15–30
Showings slow down
The market has seen it and passed at this number.
One decisive reduction to $179,900. Never a series of small cuts.
Day 31–45
Still no traction
The buyer pool at this price point has been exhausted.
Reposition to $174,000 and market to investors, where the as-is value is real.
Day 60+
Before the property goes live
Order the elevation certificate and obtain a written flood-insurance quote. Publishing the actual annual
premium alongside the listing removes the single largest unknown a buyer has about this address, and it
prevents the floodplain from becoming a negotiating lever later.
The neighborhood
Who lives here, and what a buyer is buying into.
ZIP population
19,989
ZIP 60432
Median income
$64,917
Household, ZIP 60432
Median property value
$193,700
ZIP 60432, all housing
Owner occupied
58.8%
Against 41.2% renting
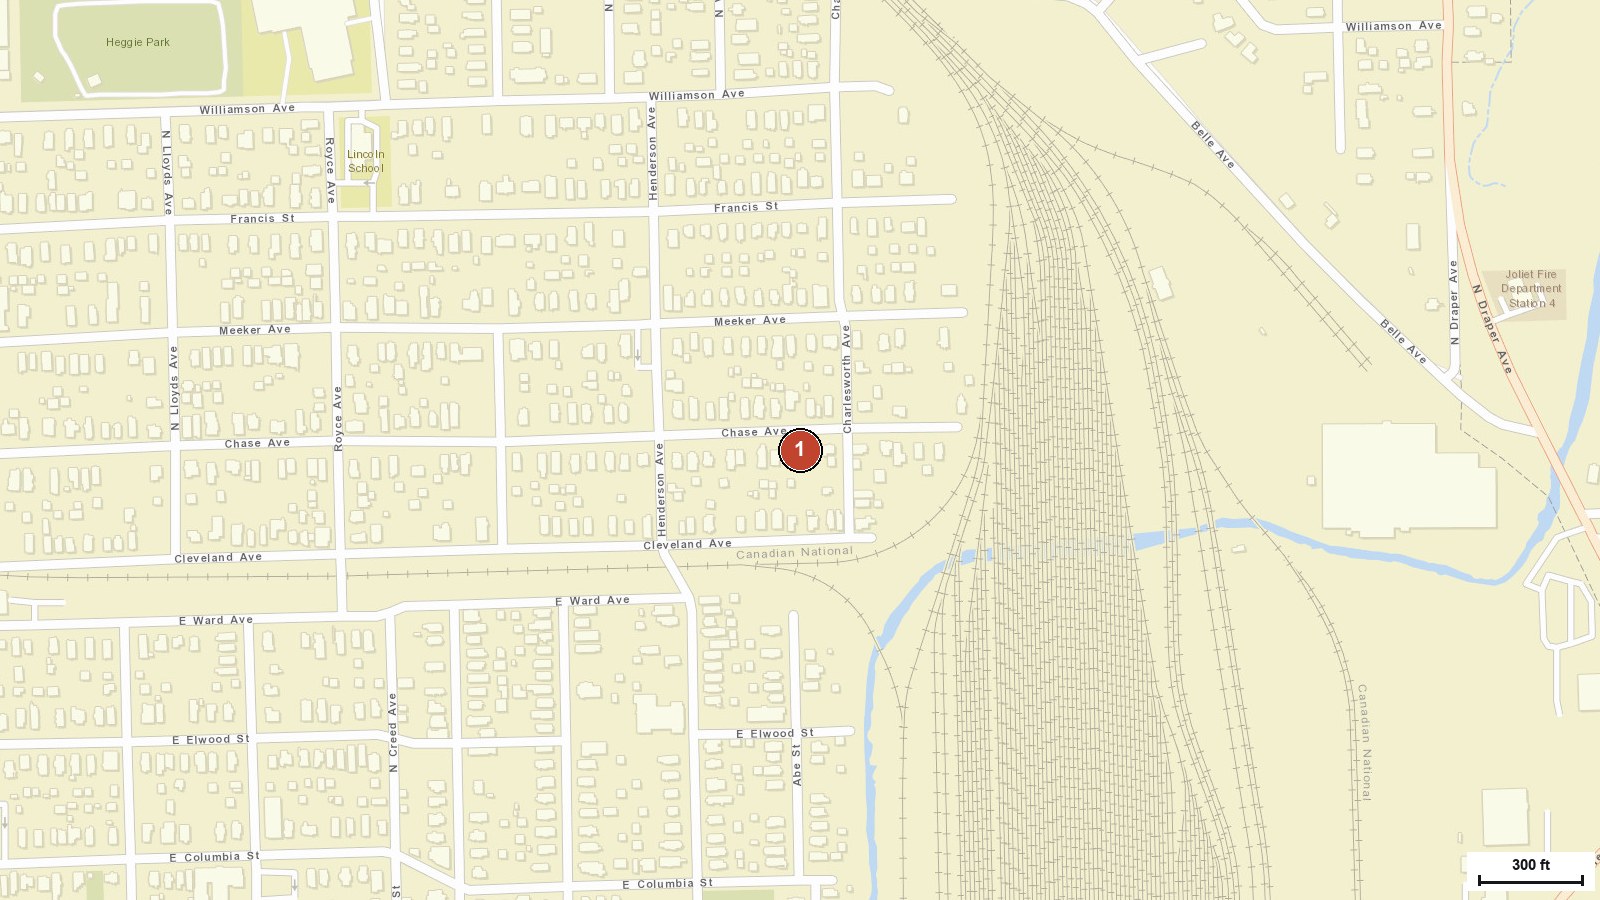
724 Chase Avenue in its street context. Map: Esri World Street Map.
Schools serving this address
School
Grades
Location
Detail
A.O. Marshall Elementary
K–5
319 Harwood St, Joliet
Joliet PSD 86 · ~235 students · Gifted & Talented program
Gompers Junior High
6–8
1501 Copperfield Ave, Joliet
Joliet PSD 86 · ~830 students
Joliet Central High School
9–12
201 E Jefferson St, Joliet
Joliet Township HSD 204 · 3,383 students · opened 1901 · on the National Register since 1982
A note on the value of that median
The ZIP median property value of $193,700 covers all housing here,
including condominiums and multi-family. A detached single-family house on
7,283 sq ft of land is not the median property in this ZIP — it is above it.
Demographics: U.S. Census American Community Survey 2011–2024 five-year
estimates. School assignment: Joliet Public Schools District 86 and Joliet Township High School District 204.
History and environment
A 125-year-old house in a city built on stone and steel.
What was happening when this house was built
724 Chase Avenue was built in 1901. That same year, the Joliet Steel Works was folded
into the newly formed United States Steel Corporation, and the plant employed more than two thousand people.
Joliet Central High School — the school this address still feeds into — opened its doors the same year.
Quarrying came first. Dolomite limestone along the Des Plaines River made Joliet the "City of Stone"
before it was a steel town, and by the 1890s roughly twenty-five quarries were working between Joliet and
Lemont. Joliet limestone went into the Chicago Water Tower and the Old State Capitol.
Where this house sits relative to the historic district
The Joliet East Side Historic District, listed on the National Register since 1980, lies southeast of
downtown and is bounded roughly by Washington Street, Union Street, Hickory Creek, Fourth Avenue and
Eastern Avenue. Chase Avenue is outside those boundaries. That matters practically: there are no historic
district review requirements attached to renovating or altering this property.
Environmental due diligence
Item
Finding
What it means here
Flood zone
ZONE AE
Whole parcel inside the one percent annual chance floodplain. Flood insurance required with a mortgage. Obtain an elevation certificate before listing.
Radon
EPA Zone 2
Will County is predicted at 2–4 pCi/L. Homeowner-submitted tests across the county have averaged higher, so test rather than assume. Kits are available through the county health department.
Structure age
1901
Expect buyer questions on wiring, plumbing and the service panel. Having answers ready shortens negotiation.
Historic overlay
None
Outside the East Side district. No preservation review on changes.
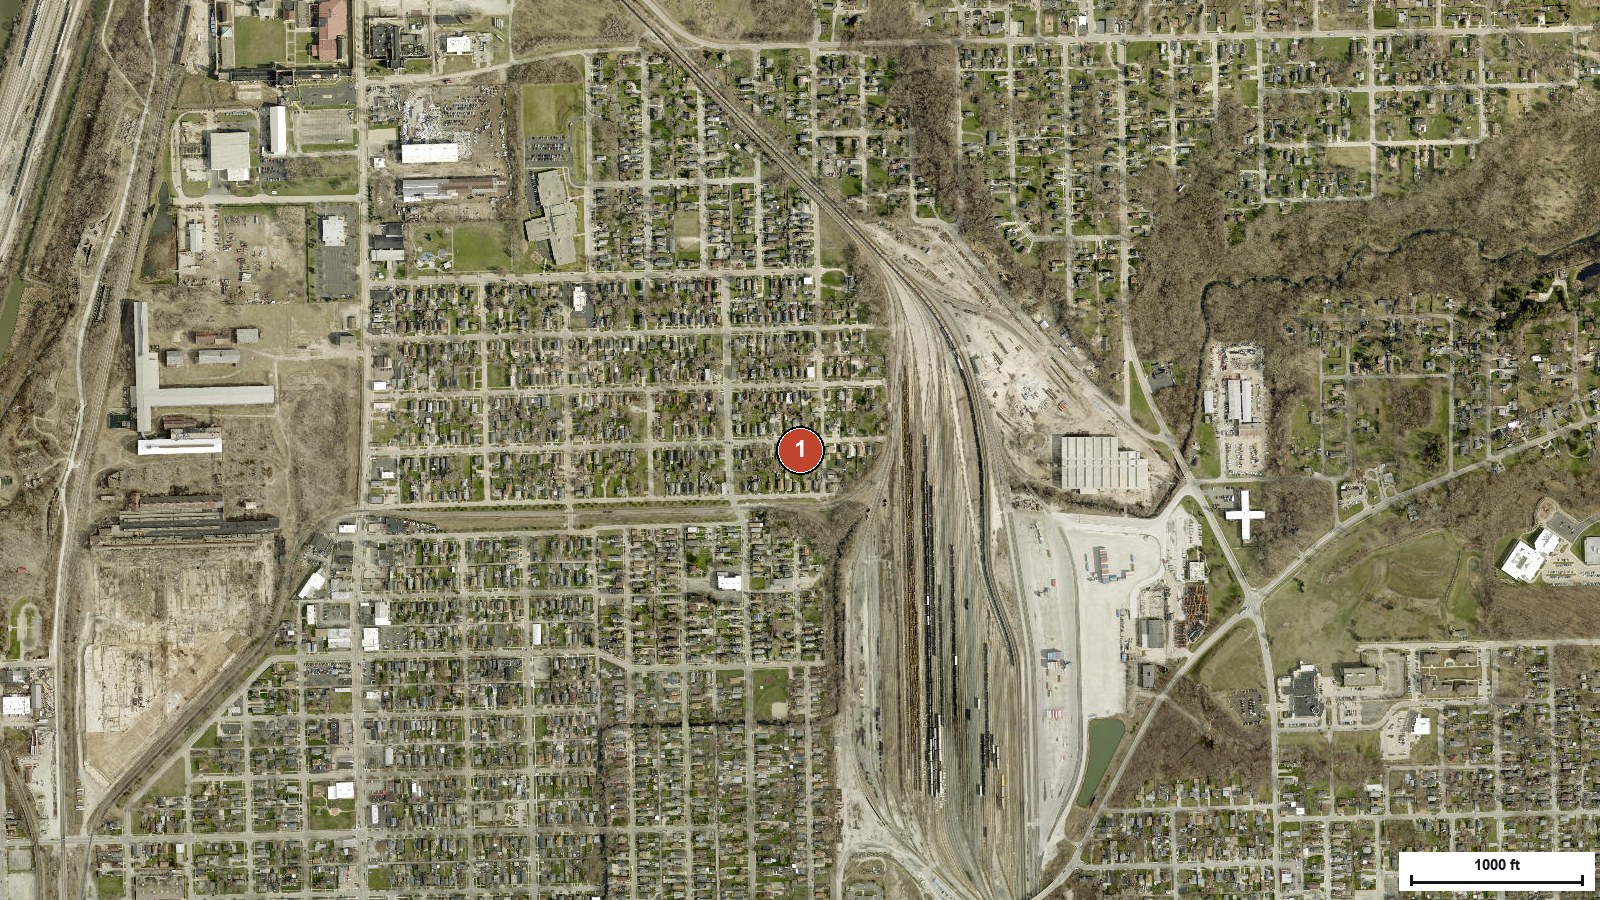
The wider neighborhood. Imagery: Esri World Imagery.
How this market transacts
No single firm controls this market.
Across the 6 verified closed sales in the core set, every one was listed through a
different office, and the highest price per square foot in the study came from a buyer brought by an outside
office. Exposure to every cooperating office matters more here than any one brand.
Core sales studied
6
Each listed through a different office.
Wider market sales
21
Similar-sized houses within two miles, past twelve months.
Closed at or above asking
2 of 6
Correct pricing gets paid in this market.
Median days on market
62
ZIP 60432, most recent measured period.
Property
Listed
Closed
Difference
$/sq ft
What it shows
2725 Chase Ave
$188,500
$188,500
at asking
$225
Directly across the street. Single-storey brick ranch, fully fenced yard. Kitchen flooring renov
3418 Irving St
$170,000
$146,500
$-23,500
$134
Marketed to investors and DIY buyers as needing updates, improvements and TLC. Full basement plu
4704 Francis St
$175,000
$172,500
$-2,500
$172
Second of only two closed sales inside the same Zone AE floodplain as the subject. Closed 1.4% u
5608 Fox St
$199,900
$195,000
$-4,900
$261
Highest price per sq ft in the set on the smallest lot in the set. Central air, crawl space, gra
6420 N Hebbard St
$180,000
$200,000
+$20,000
$226
THE AS-IS BENCHMARK. Explicitly marketed and sold as-is with newer mechanicals and a full unfini
7824 Hague St
$205,500
$205,000
$-500
$222
Closest living-area match in the set (924 sq ft vs 948). Solar panels. 2024 taxes $3,591.80 on a
Priced right, this market pays over asking
420 N Hebbard Street listed at $180,000 as-is and closed at
$200,000 — $20,000
above the asking price.
Priced wrong, the discount is severe
418 Irving Street listed at $170,000 and closed at
$146,500 — 13.8%
below asking, after being marketed as a renovation project.
How the property gets sold
A plan built around this house's actual problem.
The obstacle here is not price and it is not location. It is that a buyer cannot picture
living in the property as it currently presents. Everything below is aimed at that single problem.
Preparation
Full clean-out. Every room emptied, everything hauled. Anything the family wants kept goes out first.
Deep clean. Floors, windows, fixtures, bathrooms and kitchen taken back to bare and clean.
The lot gets cut and cleared. The 7,283 sq ft is the strongest asset here and it has to read that way from the street and from the air.
Flood paperwork in hand. Elevation certificate ordered and an insurance quote in writing before day one.
Presentation
Professional photography of an empty, clean house — never occupied rooms.
Aerial photography showing the depth of the lot, which no ground-level photo conveys.
Measured floor plan so buyers understand how 948 sq ft is laid out.
Written condition summary stating plainly what is original and what is not.
Reaching the buyer
Full MLS syndication through MRED to every portal and every cooperating office.
Direct outreach to the agents named in this report who have closed comparable property this year.
Both buyer pools worked at once — owner-occupants for price, investors for certainty and speed.
Open house in the first weekend, while the listing has its highest visibility.
Through to closing
Every showing debriefed and reported back with the actual objection, not a summary.
Offers compared on net proceeds, not headline price — financing type and contingencies decide what actually closes.
Appraisal support pack handed to the appraiser: this comp set, the adjustment grid and the parcel data.
Flood and age questions answered with documents rather than reassurance.
Timeline
From decision to closing in about twelve weeks.
Week 0
Decision and clean-out begins
The family confirms the path. Clean-out scheduled, elevation certificate ordered, insurance quote requested.
Week 1–2
Property emptied and cleaned
Full haul-away, deep clean, yard cut. Nothing cosmetic, nothing structural.
Week 2
Photography and listing preparation
Interior, exterior and aerial photography. Floor plan measured. Condition summary written. Listing built.
Week 3
Live at $184,900
Full MLS syndication, direct agent outreach, open house on the first weekend.
Week 3–6
Showings and feedback
Market averages 62 days. Every showing debriefed and reported.
Week 6–7
Offer, or one decisive adjustment
If traction has stalled, a single reduction to $179,900 — not a series of small cuts.
Week 7–12
Contract through closing
Appraisal support pack delivered. Inspection responses handled against the condition summary already published.
The only thing needed to start
A decision on which path to take, and access to
begin the clean-out. Everything else on this page is handled.
List at
$184,900
Expect
$183,000+
Prepare
2 wks
Sell in
~62 days
Sources and limitations
Where every figure came from.
Source
Used for
Reference
Will County Supervisor of Assessments
PIN and address search — parcel number, ownership, situs address
willcountysoa.com
Will County GIS — Parcels_LY and Address Points
Measured lot geometry, area, dimensions and coordinates for all nine properties
gis.willcountyillinois.com
FEMA National Flood Hazard Layer
Flood zone determination by parcel polygon and point intersect
hazards.fema.gov
Redfin Data Center — ZIP market tracker
24 months of single-family median price, price per sq ft, days on market, sale-to-list and inventory for ZIP 60432
redfin.com/news/data-center
Redfin closed-sale records and property pages
Independent confirmation of closed price and closed date
redfin.com
MRED / MLS-distributed listing data
Beds, baths, living area, list price and marketing remarks for each comparable
MRED LLC
U.S. Census ACS 5-Year Estimates
ZIP 60432 population, income, tenure and rent
census.gov
Esri World Imagery, Light Gray Canvas, World Street Map
All aerial and map graphics in this deck
arcgis.com
Joliet Public Schools District 86 / Joliet Township HSD 204
School assignment and enrollment
joliet86.org
Limitations of this analysis
No interior inspection of 724 Chase Avenue has been made. The condition adjustment is the estimate most likely to move.
Public record does not publish a bedroom or bathroom count for the subject. No bed or bath adjustment was applied in either direction.
Two of the six closed sales did not publish a listing agent in the records reviewed.
Closed sale data may omit concessions, private remarks or permit history not visible in public record.
Redfin market tracker data runs through the period ending 31 May 2026, the most recent published window.
What this document is
An independent market analysis prepared to support a listing
decision. It is not an appraisal and does not substitute for one. Where a lender requires a valuation, a
licensed appraiser will perform it — and the comp set, adjustment grid and parcel data in this report are
formatted to be handed to that appraiser directly.
All comparable sale facts should be confirmed in
MRED before the property is presented to buyers. Every parcel, flood and market figure in this report was
taken from the primary source named above on September 17, 2026.
Questions on anything in this analysis
hello@724chase.com
— every figure here can be traced back to the record it came from.
Prepared September 17, 2026 for the Hendreson family ·
724 Chase Avenue, Joliet, Illinois 60432 · Parcel 30-07-03-427-008-0000